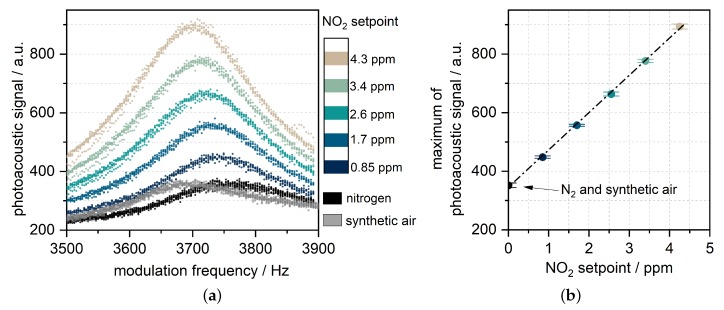
Figure 6.
(a) Lock-in filtered microphone signal (integration time of 1.14 s) while sweeping the LED modulation frequency over the third harmonic of the resonator at different NO concentrations. A reading is taken every 0.75 s. The resonance frequency shift is due to the dilution of NO in synthetic air. (b) Mean value of the three highest points of the sweep, together with their standard deviation () and the linear correlation.

