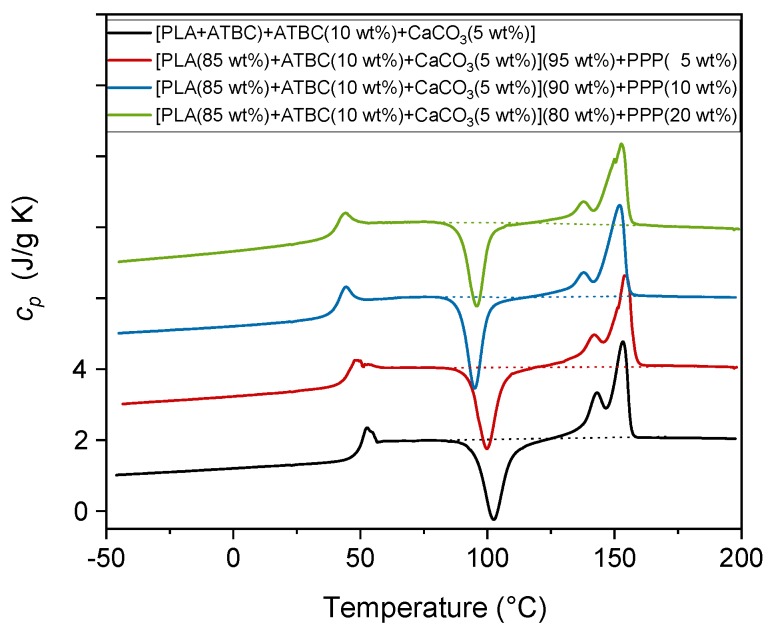
Figure 6.
Specific heat capacity (cp) of the PLA-based matrix and biocomposites indicated in the legend. The curves were obtained upon heating at 10 K/min after previously fast cooling to -50 °C. The dotted lines are the baselines used for the calculation of the Δhc and Δhm values. The ordinate values refer only to the bottom curve. All the other curves are shifted vertically for the sake of clarity.

