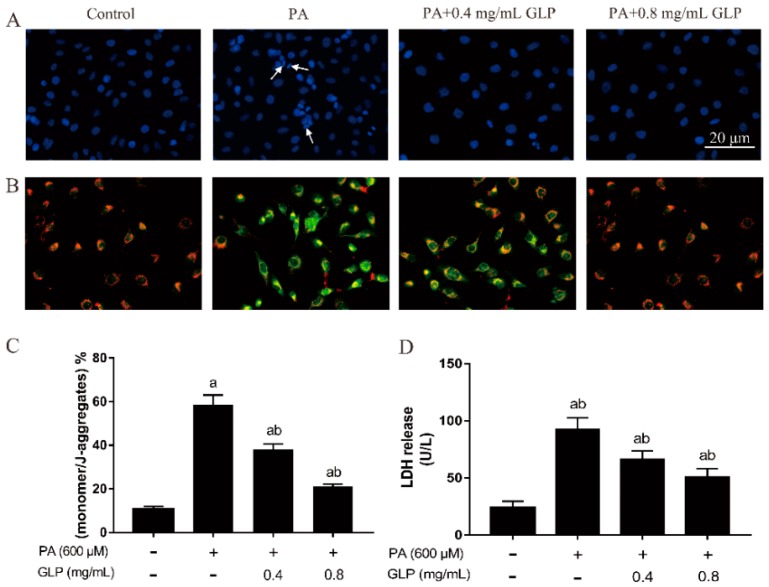
Figure 2.
The effects of GLP on apoptotic characteristics in PA-induced IPEC-J2 cells. Cells were exposed to 600 μM PA with or without 0.4 and 0.8 mg/mL of GLP for 24 h. (A) Representative images of 4’,6-diamidi-no-2-phenylindole (DAPI) staining (blue). Arrows denote chromatin condensation and fragmentation. Original magnification 400×. (B) The mitochondrial membrane potential was examined by JC-1 staining. JC-1 aggregate and JC-1 monomer exhibited red and green fluorescence, respectively (400×). (C) JC-1 staining quantification results are presented as the mean of monomer/J-aggregates ± SE. (D) The release of LDH was analyzed using a commercially available kit and calculated as U/L. Data were presented as mean ± SE for three independent experiments (n = 3), a < 0.01 vs. control, b < 0.01 vs. PA alone.

