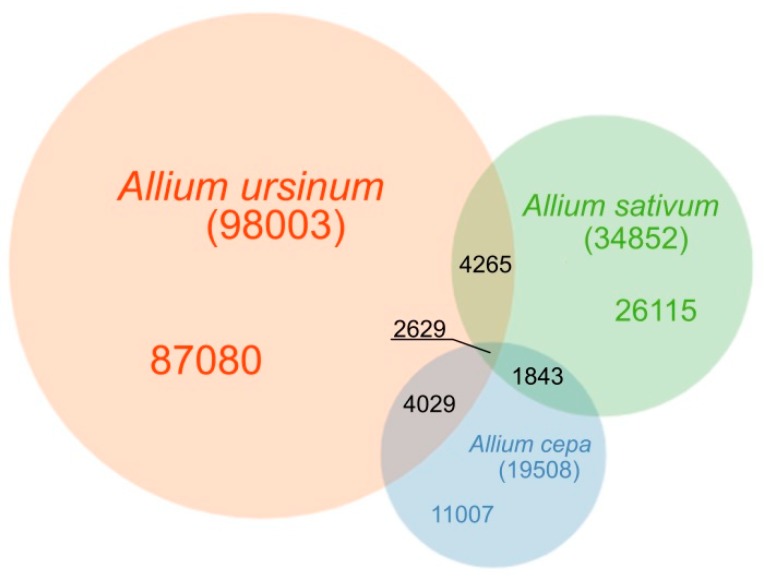
Figure 1.
Venn diagram of detected short tandem motifs in A. cepa, A. sativum and A. ursinum. The diagram shows how many distinct motifs were identified in the three species and how many of them are shared. However, it represents a total sequence variability of detected motifs rather than genome proportions of these motifs, because the largest variability in the sequence of the motifs comes from very rare short tandem repeats. In the shortest motifs predominantly AT rich sequences are detected. This trend of excluding GC rich sequences in tandems is not so obvious in the case of the longer motifs we obtained.

