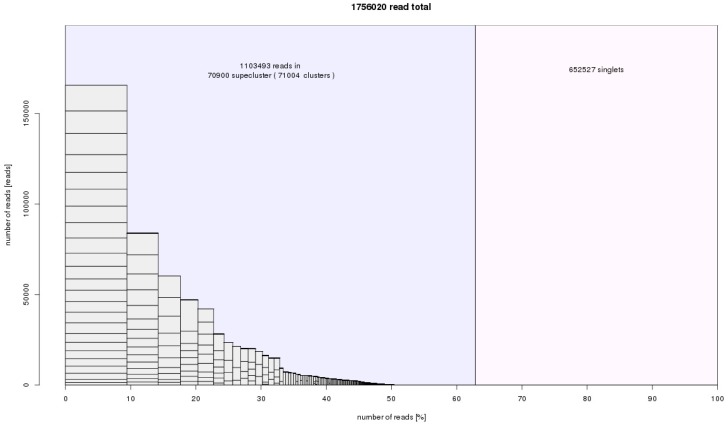
Figure 4.
RepeatExplorer histogram summary of superclusters, clusters and non-clustered reads. The input was 1,756,020 reads from A. cepa, A. ursinum, and A. sativum. The number of reads from each species was normalized according to genome size. We obtained 70,900 superclusters representing groups of repetitive elements. The genomic proportion of these identified repeats was 63%. The non-clustered reads, which represent 27% of genome, are low copy and single copy sequences that cannot be characterised in RepeatExplorer analysis. This statistic is slightly distorted by plastid sequences that also form separate clusters. They are not further counted after cluster annotation (Table 1).

