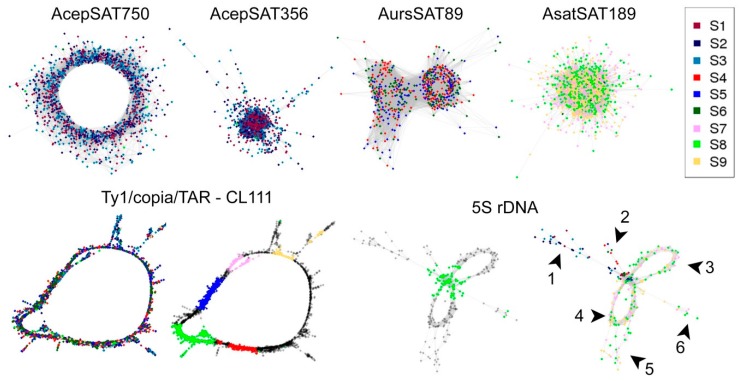
Figure 5.
Results of graph-based clustering in TAREAN comparative analysis. AcepSAT750 has a ring-shaped cluster of exclusively A. cepa reads. Repeats with shorter monomer lengths, AcepSAT356, AursSAT789, and AsatSAT189 have more compact graphs. Surprisingly, one Ty1/copia/TAR sublineage forms a graph shared by all three species (genes in a typical order for copia-like elements: GAG—yellow; PROT—pink; INT—blue; RT—green; RH—red). Consensus of these repeats is in the separate supplementary file File S1. The graph of 5S rDNA presents information about the reads containing 5S rRNA gene—green dots, and species-specific intergenic spacers are labelled by arrowheads and numbers (1—A. cepa; 2—A. ursinum; 3–6—A. sativum).

