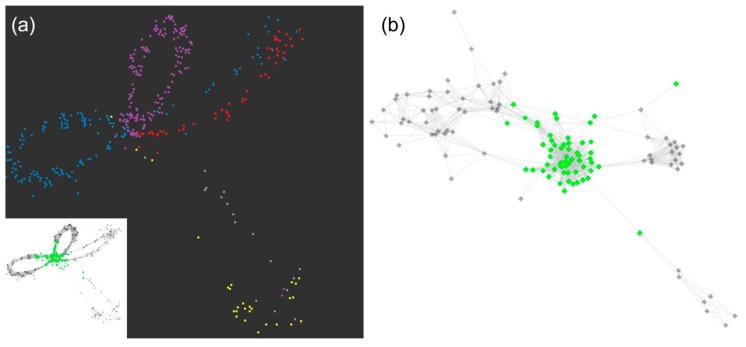
Figure 7.
5S rDNA cluster in A. sativum and A. cepa in separate RepeatExplorer and TAREAN analyses. Dots represent reads, edges represent identified similarities (overlaps) between the reads. 5S rRNA gene reads are in green, intergenic spacers in black. (a) Cluster of 5S rDNA of A. sativum. The colours (dark graph) stand for specific contigs representing variability of the spacer (red—CL100Contig1, pink–CL100Contig2, grey—CL100Contig3 and CL100Contig4, blue—CL100Contig5, and yellow—CL100Contig5). (b) Cluster of 5S rDNA of A.cepa. The green core of the graph represents 5S rDNA genes and the two black loops represent two variants of the intergenic spacer in A. cepa.

