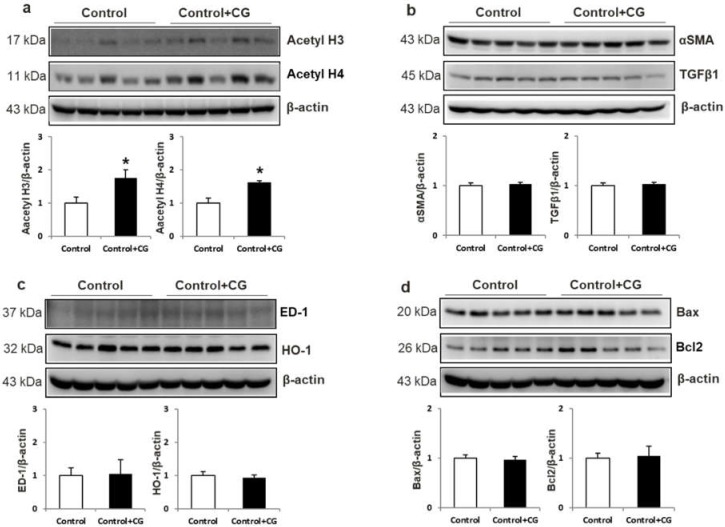
Figure 8.
Toxicity of GC200745 (CG) to control rats. Semiquantitative immunoblotting of acetyl H3 and acetyl H4 in the kidney. Densitometric analysis revealed that the protein expression of acetyl H3 and acetyl H4 was increased in the CG-treated control group compared to that in controls (a). α-SMA and TGF-β (b), ED-1 and HO-1 (c), and Bax and Bcl2 (d) expression levels were not different between control and control + CG groups. * p < 0.05, when control + CG groups were compared to control group.

