Figure 5.
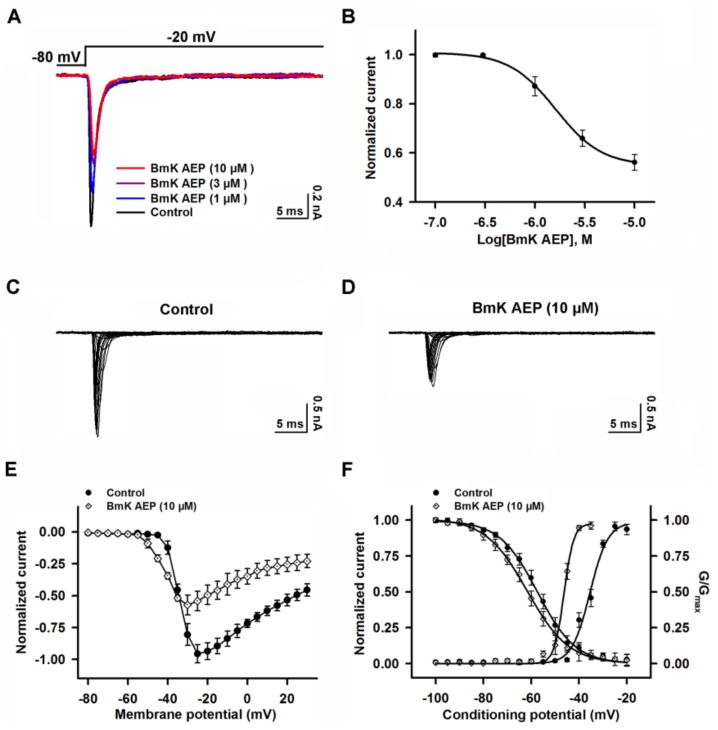
Influence of BmK AEP on hNav1.3 expressed in HEK-293 cells. (A) Representative traces of BmK AEP suppression of the Nav1.3 peak current. Na+ currents were elicited by a 50-ms depolarization to −20 mV from a holding potential of −80 mV. (B) Concentration–response relationship curve of BmK AEP inhibition of Nav1.3 currents. (C,D) Representative traces of Nav1.3 currents in the absence and presence of 10 μM BmK AEP, respectively. Currents were trigged by 50-ms depolarizations from −100 to 30 mV in a 5-mV step. (E) Normalized I–V relationships of Nav1.3 currents in the absence and presence of 10 µM BmK AEP. (F) Effect of BmK AEP (10 µM) on the steady-state activation and inactivation of Nav1.3. Each data point represents the mean ± SEM (n = 5–8).

