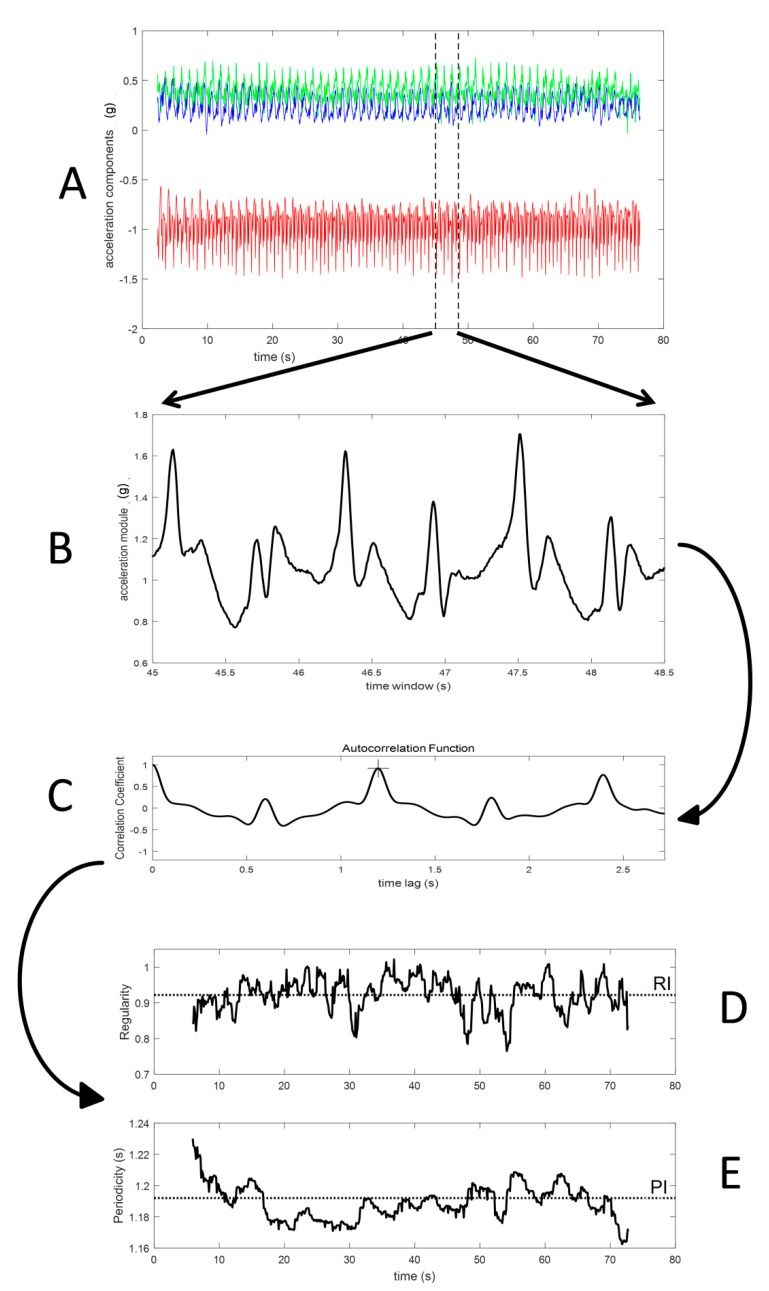
Figure 2.
Method data flow: (A) raw recording from triaxial accelerometer; (B) window of acceleration module; (C) autocorrelation function computed on standardized windowed data (the cross marks the autocorrelation peak which corresponds to the window fundamental period); (D) the regularity time profile (the dotted line represents the window average value considered as a regularity index (RI)); (E) the fundamental period time profile (the dotted line represents the window average value considered as the period index (PI)).

