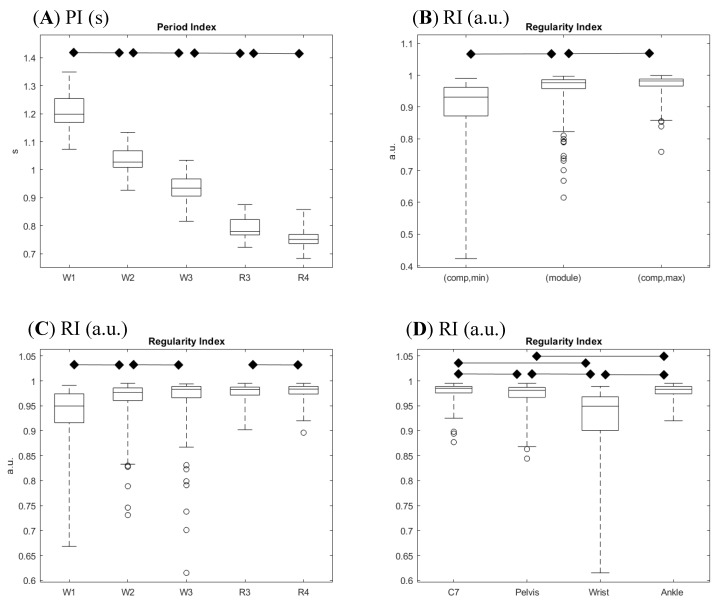
Figure 4.
Composite presentation of results in 4 panels. (A) Period index (PI) distribution across tasks performed at different speeds and different modalities. (B) Comparison of the module-based regularity index (RI; center box) with the minimum (left box) and the maximum (right box) regularity indexes as computed on single components. (C) Regularity index distribution across tasks performed at different speeds and different modalities. (D) Regularity index distribution across sensor positions. Legends refer to tasks (W1, W2, and W3 for walking at 1.0, 1.4, and 1.8 m/s, respectively; R3 and R4 are for running at 1.8 and 2.2 m/s, respectively), to sensor positions (C7 on the posterior spinous process of the seventh cervical vertebra, pelvis on the midpoint between posterior superior iliac spine, wrist on the dorsal aspect of the right wrist, and ankle on the lateral aspect of right ankle), and to index definition (module for proposed computation on module of acceleration vector, min and max for extreme outcomes in single acceleration component computation). Boxes report medians and quartiles, whiskers represent extremes, and dots represent outliers. Horizontal bars with diamonds mark significant differences (p ≤ 0.05, corrected for multiple tests) according to planned statistical analysis.

