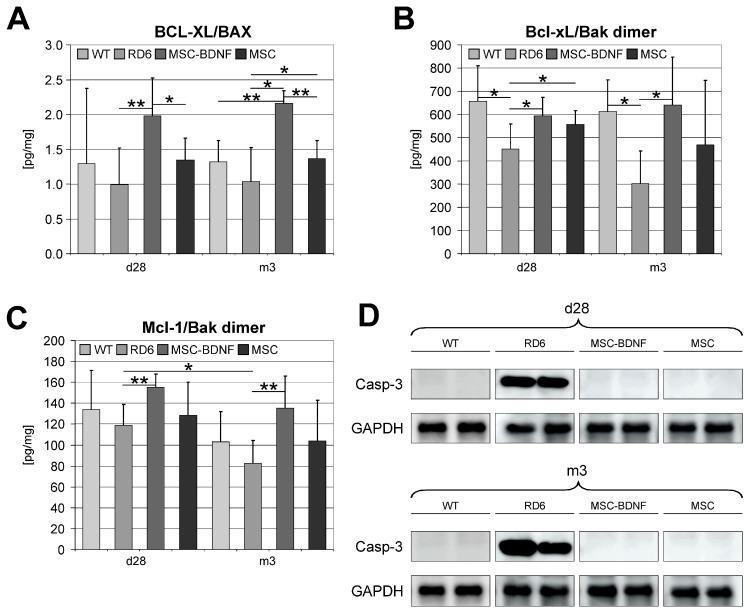
Figure 4.
The expression profile of selected apoptosis-related molecules in retinas treated with MSC-BDNF or MSC alone at different time points (at 28 days and three months post transplantation) and compared to WT and rd6 mice. The mRNA expression of Bcl-xL and BAX genes was determined by the quantitative PCR and the relative ratio Bcl-xL/BAX was calculated (A). The concentration of Bcl-xL and Bak protein dimer was determined by specific Luminex (B) Similarly, the concentration of Mcl-1/Bak dimer protein was measured (C). Caspase-3 protein expression was determined by Western blot, which revealed a lack of expression of this form in WT mice and rd6 after cell transplantation compared to rd6 mice with no treatment (D). GAPDH served as loading. A representative image is shown. Mean values ± SDs are presented in the diagrams, * p < 0.05, ** p < 0.01 (n = 7/group/time point).

