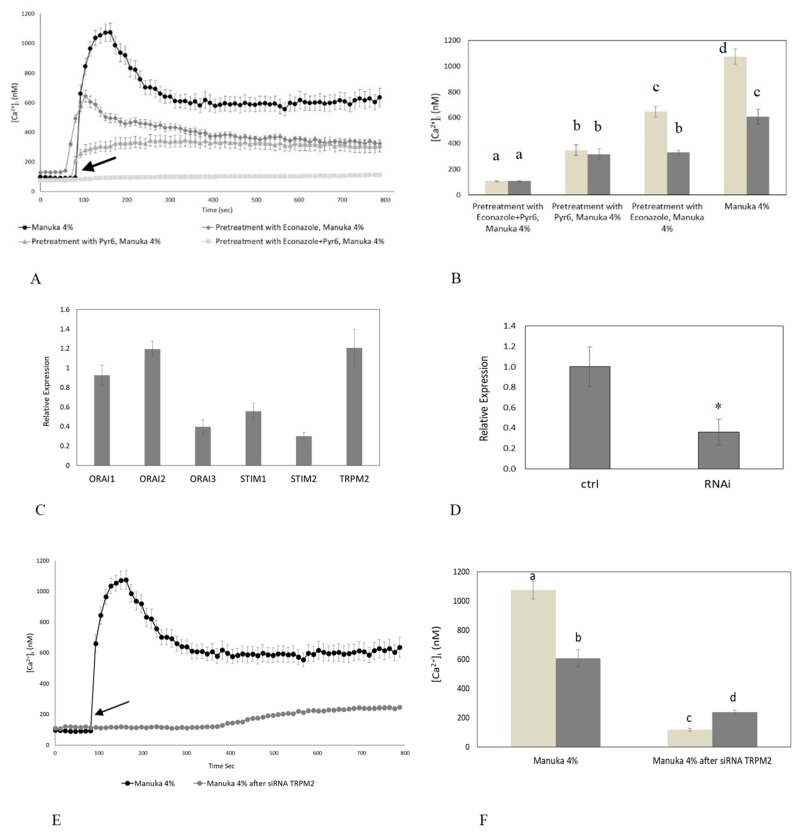
Figure 4.
The inhibition of TRPM2 and Orai1 channels abolishes manuka honey-induced Ca2+ entry. (A) Manuka honey-induced Ca2+ entry was dramatically reduced in the presence of either 10 µM Econazole or 1 µM Pyr6 (30 min preincubation for each drug) and completely abolished by the simultaneous treatment with both drugs. Manuka honey was added at 4% v/v. The arrow indicates the addition of manuka honey after 60 s. Data are presented as means ± SEM of [Ca2+]i traces recorded in different cells. Number of cells: manuka honey: 40 cells from 3 exp; manuka honey + Econazole 10 µM: 50 cells from 3 exp; manuka honey + Pyr6 1 µM: 50 cells from 3 exp; manuka honey + Econazole 10 µM + Pyr6 1 µM: 50 cells from 3 exp. (B) Mean ± SEM of the Ca2+ response to 4% v/v manuka honey recorded at the peak (light bars) and at the plateau (dark bars) under the designated treatments. Data are presented as means ± SEM of [Ca2+]i measured by confocal imaging at peak maxima. Number of cells as in (A). Different letters above the bars indicate statistical difference determined by Two-way ANOVA with Bonferroni’s correction (p < 0.01). (C) The mRNA quantity of Stim1-2, Orai1-3 and TRPM2 transcripts was determined by qRT-PCR and is represented as mean relative expression ± SD (n = 3). (D) Expression of TRPM2 gene in HaCaT cells after RNAi. The mRNA quantity of TRPM2 was determined by qRT-PCR and is represented as mean relative expression ± SD (n = 3, * p < 0.001, t-test). (E) The Ca2+ response to 4% v/v manuka honey was suppressed in HaCaT cells transfected with a RNAi selectively targeting TRPM2. The arrow indicates the addition of manuka honey after 60 s. Data are presented as means ± SEM of [Ca2+]i traces recorded in different cells. Number of cells: manuka honey: 40 cells from 3 exp; manuka honey after RNAi for TRPM2: 40 cells from 3 exp. (F). Mean ± SEM of the Ca2+ response to 4% v/v manuka honey recorded at the peak (light bars) and at the plateau (dark bars) under the designate treatments. Number of cells as in (E). Different letters above the bars indicate statistical difference determined by two-way ANOVA with Bonferroni’s correction (p < 0.01).

