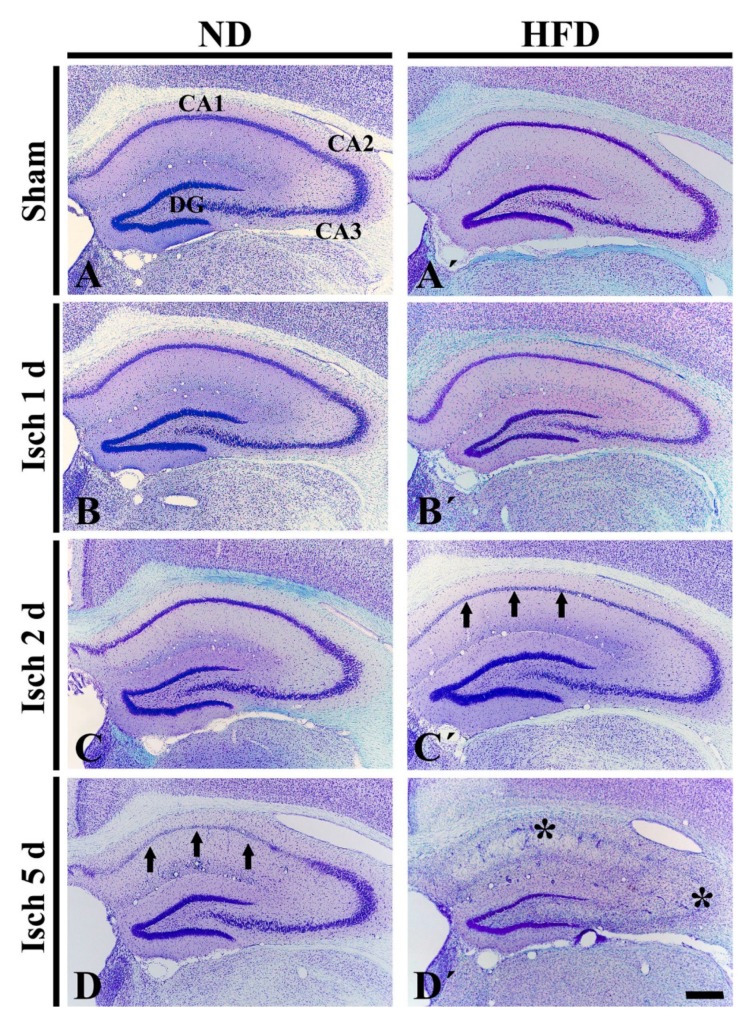
Figure 1.
CV staining in the hippocampus of the ND-fed (left column) and HFD-fed (right column) groups at sham (A,A’), 1 day (B,B′), 2 days (C,C′) and 5 days (D,D′) after tGCI. In the ND-ischemia group, CV+ cells are pale (damaged) in the CA1 area (arrows) 5 days after tGCI. In the HFD-ischemia-group, damaged CV+ cells in the CA1 area (arrows) is shown 2 days after tGCI, and, 5 days after tGCI, severely damaged CV+ cells are shown in the CA2/3 area (asterisk) as well as CA1 area (asterisk). DG, dentate gyrus. Scale bar = 400 μm.

