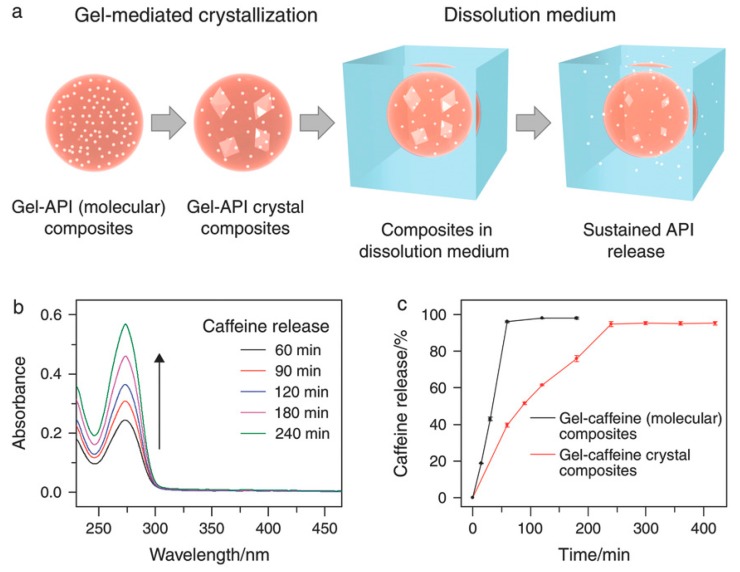
Figure 14.
(a) Illustration of the process for sustained drug release from the TA–Ti(IV)–drug crystal Composites, (b) UV–vis absorption spectra of the caffeine released from the TA–Ti(IV)–caffeine crystal composite particles over time, (c) graph showing the release profiles of caffeine from the gel–caffeine composites. Reproduced with permission from Reference [96].

