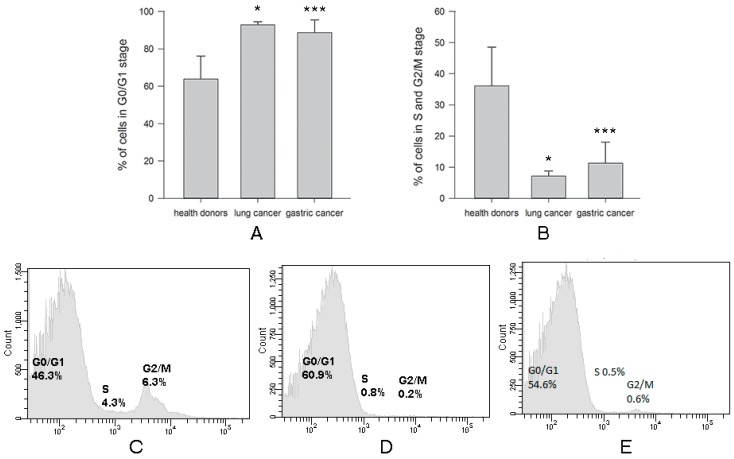
Figure 4.
Differences in % NK cells in cell cycle phases harvested from healthy donors and cancer patients. NK cells were isolated from the peripheral blood samples by negative selection using Dynabeads. Cell cycle was determined as described in M&M. (A) Data of % NK cells in G0/G1 stage are shown as the mean ± SEM (ANOVA). (B) Data of % NK cells in S and G2/M stage are shown as the mean ± SEM (ANOVA). (C) Cell cycle of NK cells from one of 10 representative healthy donors. (D) Cell cycle of NK cells from one of 7 representative patients with lung cancer. (E) Cell cycle of NK cells from one of 12 representative patients with gastric cancer. (* p < 0.05 and *** p < 0.001).

