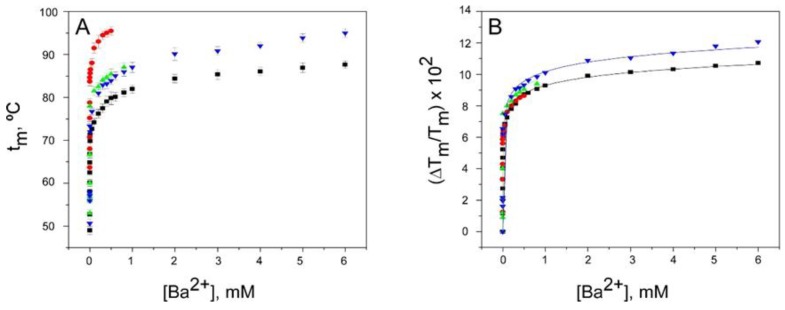
Figure 4.
Binding of Ba2+ to KcsA. Panel A illustrates Ba2+ binding to KcsA channels, monitored through the Ba2+ concentration dependence of the tm of thermal denaturation. The results are the average (n = 3) tm (in Celsius) ± SD. The symbols and colors are the same as in Figure 2. Panel B shows the fitting of the experimental data from Panel A to Equation (1) (see Methods). The apparent KD values for the above binding events are given in Table 1.

