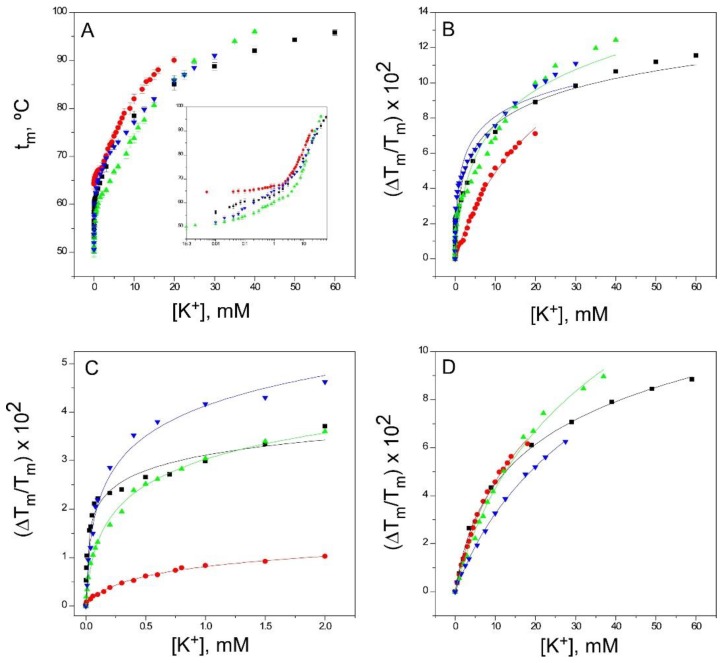
Figure 5.
Binding of K+ to KcsA. Panel A shows K+ titrations covering the widest possible range of concentrations (i.e., those increasing the tm to near the thermostat limit of our circulating water bath) conducted on KcsA samples containing 1.5 mM Na+ as the starting point. The results are the average (n = 3) tm (in Celsius) ± SD. The symbols and colors are the same as in Figure 2. Inset to panel A are semi-log plots of the binding processes to illustrate in a simple manner the presence of two different sets of K+ binding sites. Indeed, fitting the data from panel A to Equation (1) fails when taking into account the whole titration curve (i.e., assuming a single set of binding sites) (Panel B), but it suffices when the low (Panel C) and the high (Panel D) K+ concentration ranges are analyzed separately, suggesting that at least two different sets of K+ binding sites are present in the KcsA samples. The analysis of the binding data to more than one set of binding sites and the determination of the apparent dissociation constants for the individual binding events, as in Figure 5, Figure 6 and Figure 7, have been described in detail in the Supplementary Information to Reference [33]. The apparent KD values estimated for the above binding events are given in Table 1.

