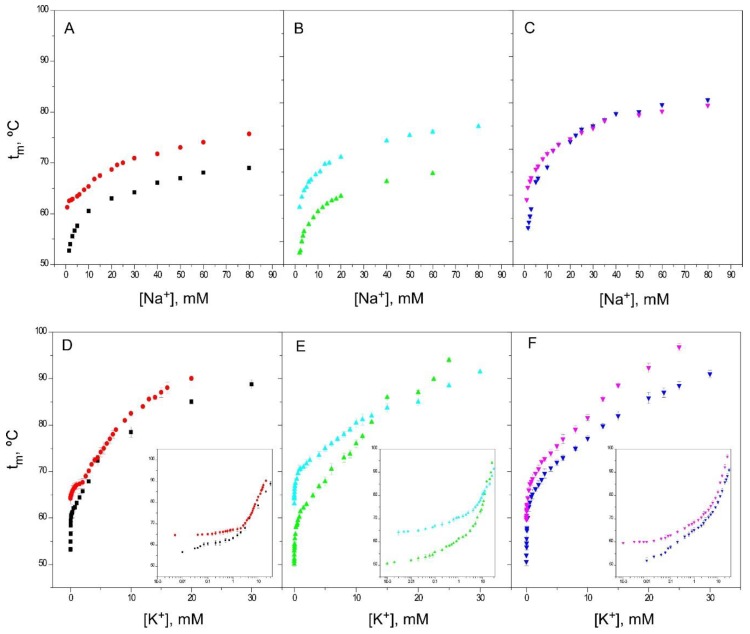
Figure 8.
Effect of pH 4 on the thermal stability of the different KcsA models. Panels A, B and C compare the Na+ binding profiles, while Panels D, E and F show the K+ binding profiles (and the corresponding semi-log plots as insets) of the same KcsA samples prepared at pH 7 and pH 4. The results are the average (n = 3) tm (in Celsius) ± SD. Symbols and colors are WT KcsA at pH 4 (●) and pH 7 (■); 1–125 KcsA at pH 4 (▲) and pH 7 (▲) and OPEN KcsA at pH 4 (▼) and pH 7 (▼).

