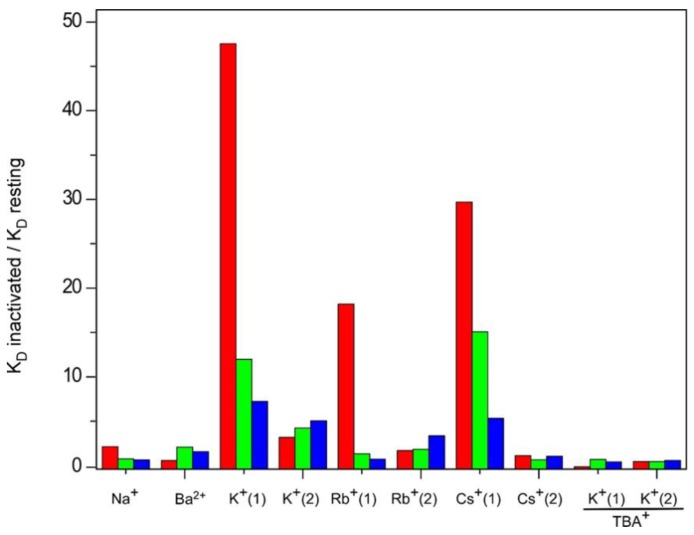
Figure 10.
Relative affinities for nonpermeant and permeant cations presented by the three KcsA inactivated model channels, with respect to the resting state. The bar graph shows the ratio between the mean apparent KD’s of the inactivated and resting states given in Table 1. Colors represent: KcsA at pH 4 (■), 1–125 KcsA at pH 7 (■) and OPEN KcsA at pH 7 (■).

