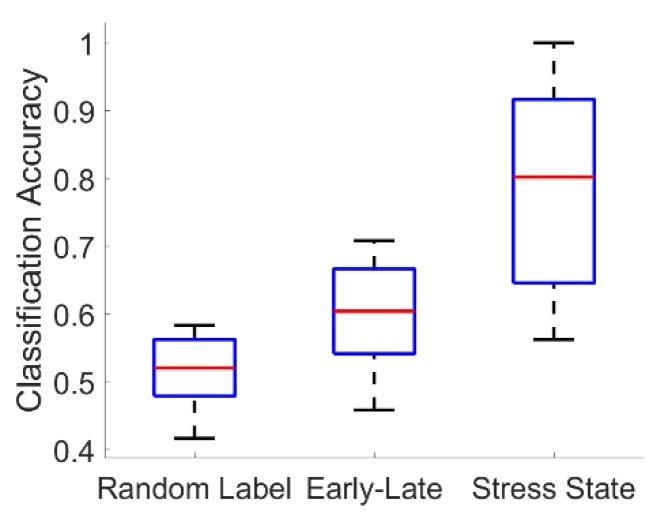
Figure 8.
Summary of representative fused-feature classification results. Boxplots show the distribution of classifier accuracies across all 18 subjects for a chance logistic regression classifier formed by randomly permuting the congruent and incongruent labels (“Random Label”); a null logistic regression classifier formed by training to discriminate early versus late segments in congruent experimental sessions (“Early-Late”); and the actual logistic regression stress-state classifier trained to discriminate congruent from incongruent segments (“Stress State”).

