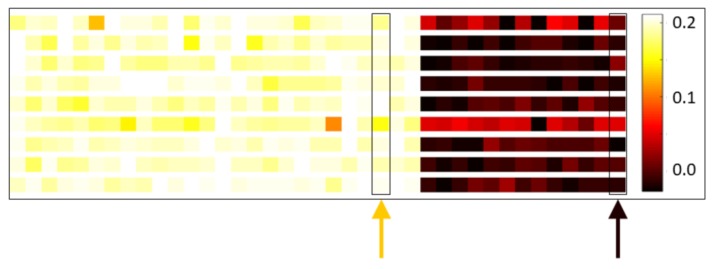
Figure 9.
First principal component loadings. Visualization of the average first principal component loadings for nine randomly selected subjects (one subject per row). Each row consists of 39 colored panels, one for each of the 39 electrode–RMS feature combinations used for classification. The panels are colored in proportion to the contribution of their corresponding feature to the first principal component; they are ordered in three blocks of 13 corresponding to the 13 analyzed electrodes, with the leftmost block representing the theta RMS feature, the middle block representing the alpha RMS feature, and the rightmost block representing the beta RMS feature. Within each block, the electrode ordering is as follows: F7, F3, Fc5, T7, P7, O1, O2, P8, T8, Fc6, F4, F8, and Af4. For example, the leftmost panel in all rows represents θ RMS on electrode F7 and the rightmost panel β RMS on Af4. Lighter color panels indicate electrode–RMS feature combinations with stronger positive weightings. The orange arrow indicates one particular combination that has relatively high-magnitude weight across subjects; the black arrow indicates one with relatively low-magnitude weight.

