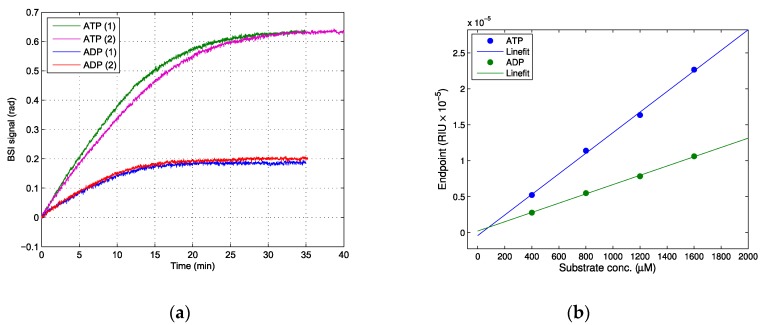
Figure 3.
The enzymatic hydrolysis of ATP and ADP to AMP by apyrase. (a) The real-time measurement of 1.6 mM ATP and ADP (duplicate runs are shown for both ATP and ADP). (b) The linear fit of end-point values in refractive index units vs. initial substrate concentration. ATP (blue) R2 > 0.99, slope 1.51 × 10⁻⁵ RIU/mM, ADP (green) R2 > 0.99, slope 0.68 × 10⁻⁵ RIU/mM.

