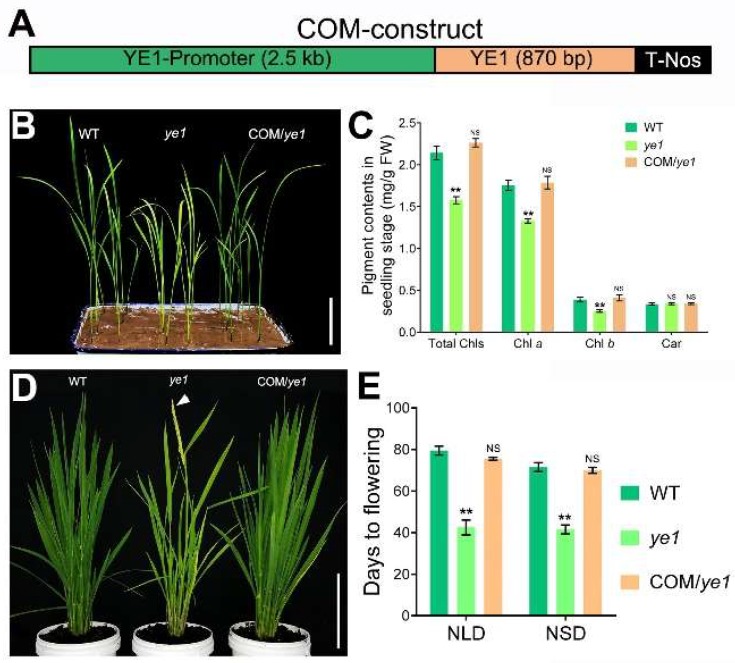
Figure 4.
Complementation of ye1 mutant. (A) The construct for complementary analysis of YE1 gene. (B) Leaf color phenotypes of WT, ye1 and complementary plants (COM/ye1). Bar = 5 cm. (C) Comparisons of pigment contents of WT, ye1 and complementary plants. (D) Flowering time phenotypes of WT, ye1 and complementary plants under NLDs, when ye1 was heading. The arrow indicates the flower. Bar = 25 cm. (E) Days to flowering of WT, ye1 and complementary plants under NLDs and NSDs. Each value is given as means ± SD (n = 3). NS, no significant change. * (p < 0.05) and ** (p < 0.01) indicate significant differences compared with WT (Student’s t-test).

