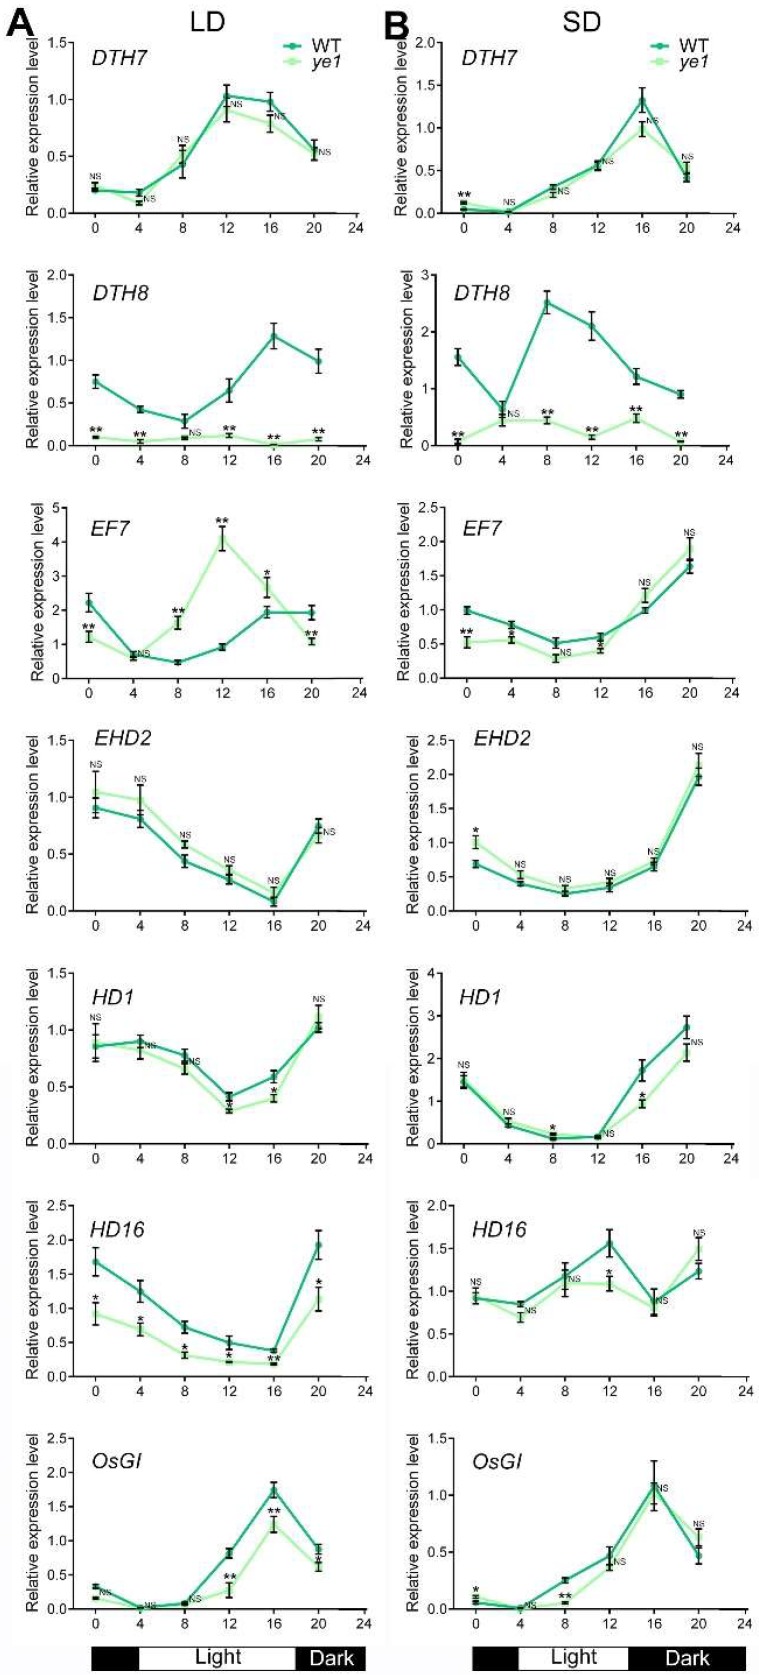
Figure 8.
Rhythmic expression patterns of photoperiodic flowering-associated genes in WT and ye1. (A) Rhythmic expression patterns of DTH7, DTH8, EF7, EHD2, HD1, HD16, and OsGI under LDs. (B) Rhythmic expression patterns of DTH7, DTH8, EF7, EHD2, HD1, HD16, and OsGI under SDs. Each value is given as means ± SEM (n = 3). NS, no significant change. * (p < 0.05) and ** (p < 0.01) indicate significant differences compared with WT (Student’s t-test).

