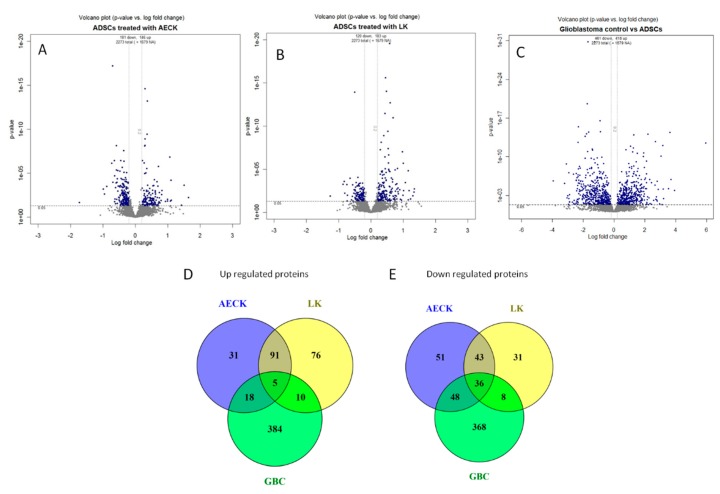
Figure 2.
Volcano plots (A–C) showing p-values versus protein fold change (log2) of ADSCs and comparisons generated with DanteR. Quantitation criteria cutoff of statistically significant p-values < 0.05 and fold change log2 ratio cutoff of <−0.2 or >0.2. The blue nodes represent the above >0 log fold change, i.e., up-regulated proteins and the below <0 fold change down-regulated proteins. The grey nodes represent the not significantly changed proteins with a p-value > 0.05 and within the cut off for fold change. (D,E) Three-way Venn diagrams of up and down regulated proteins. Diagrams include the AECK treated, LK treated hADSCs, and the GBCs showing unique and shared proteins. (D) up regulated proteins revealing there are 31, 76, 384 with 91, 10, 18 shared proteins between each of the corresponding tested cell lines as well as 5 shared proteins between all three relative to basal hADSCs. (E) down regulated proteins revealing there are 51, 31, and 368 unique proteins with 43, 8, and 48 shared proteins between each of the corresponding tested cell lines as well as 36 shared proteins between all three relative to basal hADSCs.

