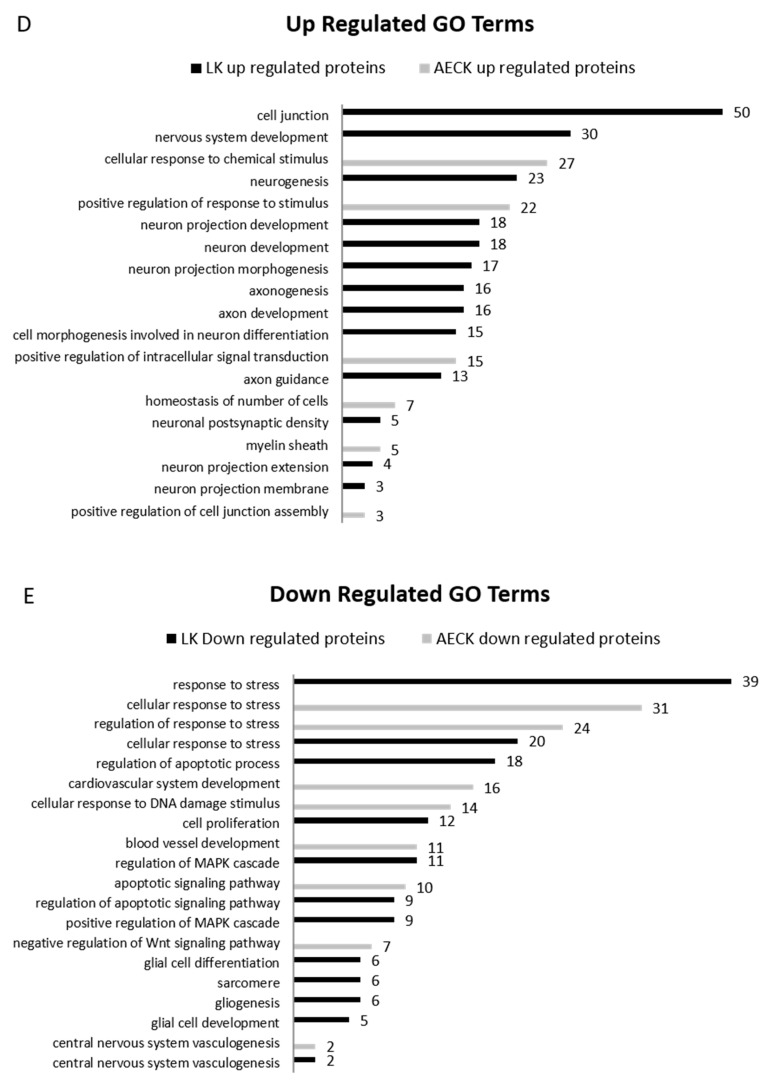
Figure 3.
Interaction Networks (A) Presents the iTRAQ dataset of 2430 unique proteins nodes each individually colored with a cumulative 90,855 annotated or canonical interactions between proteins across the network presented in grey edge lines. (B) Presents the iTRAQ dataset of the full network with all up-regulated protein nodes present in blue and down-regulated protein nodes in red. (C) Presents the AECK unique protein nodes as “triangles”, LK protein nodes as squares and shared protein nodes as “circles”. This is in conjunction with the color indication of up regulated proteins in blue and down regulated in red. (D,E) number of up and down regulated proteins by GO terms respectively.


