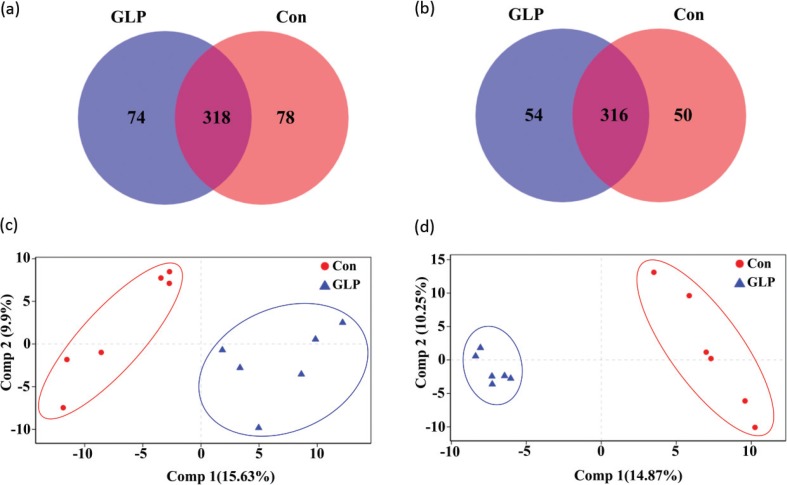
Fig. 3.
Venn diagrams and PLS-DA plots of small intestinal and cecal microbiota at the operational taxonomic unit level in rats in two different groups. (a) Venn diagram of small intestinal microbiota, (b) Venn diagram of cecal microbiota, (c) PLS-DA plots of small intestinal microbiota, and (d) PLS-DA plots of cecal microbiota. Con: Group Con rats were fed a basal diet (D12450-B) with DSS-induced colitis; GLP: Group GLP rats were fed a GLP diet with DSS-induced colitis.

