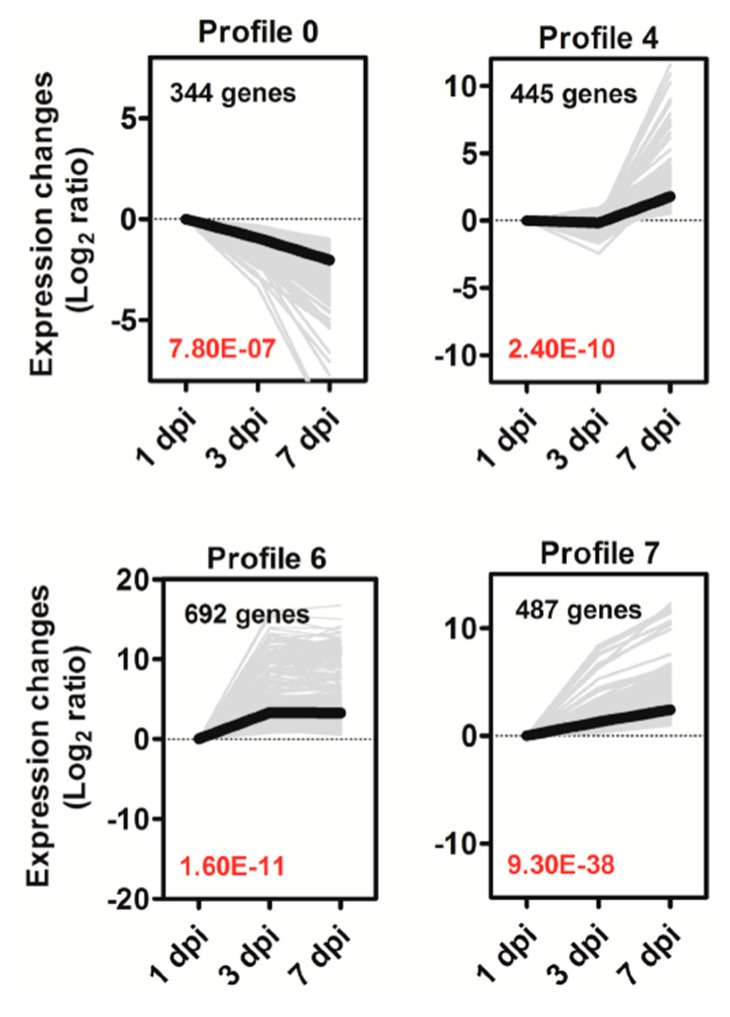
Figure 5.
Expression profiles of DEGs in the four main clusters. The top left-hand corner indicates the number of DEGs belonging to the profile. The lower left-hand corner contains the p-value of the profile. The gray lines represent the DEGs, and the bold black line represents the expression tendency of all these DEGs. The x-axis represents days after R. solanacearum inoculation (dpi). The Y-axes represents log2 fold change in gene expression between treatments.

