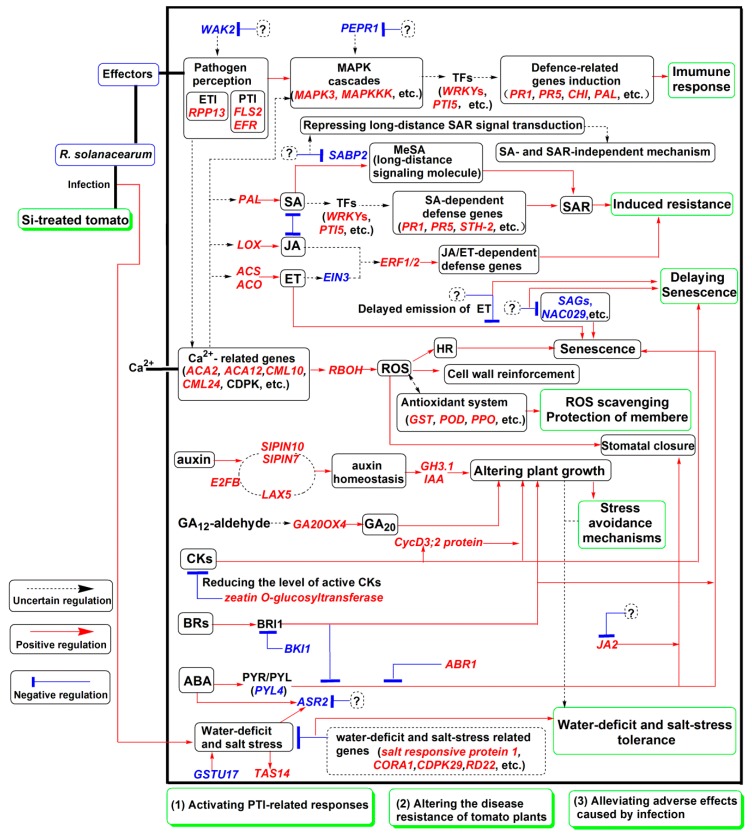
Figure 7.
Hypothetical schematic model showing mechanisms involved in silicon (Si)-mediated tomato resistance against R. solanacearum. Upregulated genes are marked in red italics, and downregulated genes are marked in blue italics. Black dotted lines with arrows denote uncertain regulation; red lines with arrows denote positive regulation; and blue lines with bars indicate negative regulation. Question marks indicate unclear events. Several crosstalk and feedback mechanisms between multiple pathways are not presented in the model.

