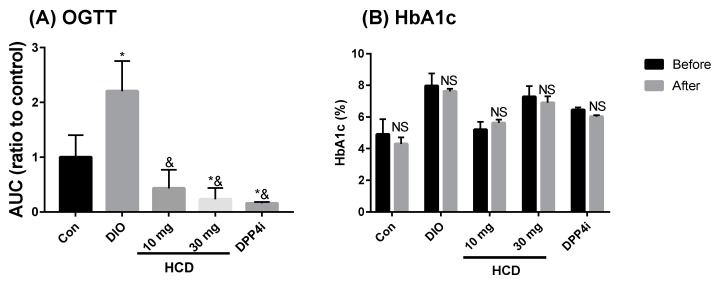
Figure 6.
Insulin tolerance and glycated hemoglobulin (HbA1c) levels after long-term administration of natural compounds. DIO mice were fed with natural compounds for 5 weeks and insulin tolerance measured through (A) OGTT and (B) HbA1c levels. All results were mean ± SD from 6 individuals. * p < 0.05 meant significantly different as compared with Con (A) or before treatment (B), and & p < 0.05 represented significantly different from DIO mice.

