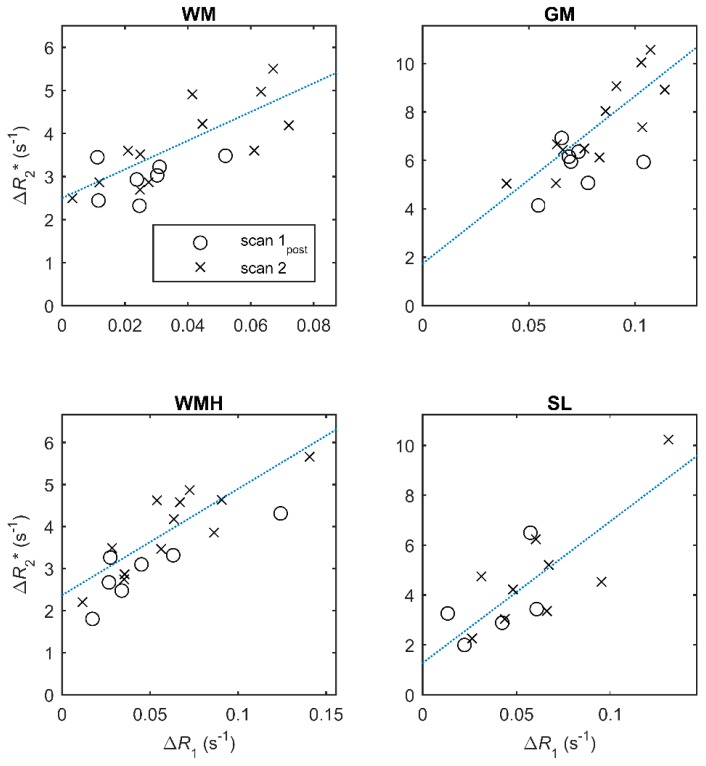
Figure 4.
Change in R2* (ΔR2*) versus change in R1 (ΔR1) at scan 1post (immediately post-USPIO; circles) and at scan 2 (24–30 h post-USPIO; crosses). Each data point represents the change in relaxation rate for a subject relative to the value measured at scan 1 (pre-USPIO). Dotted lines show the best fit to the data at scan 2; full linear regression results are given in Table 3.

