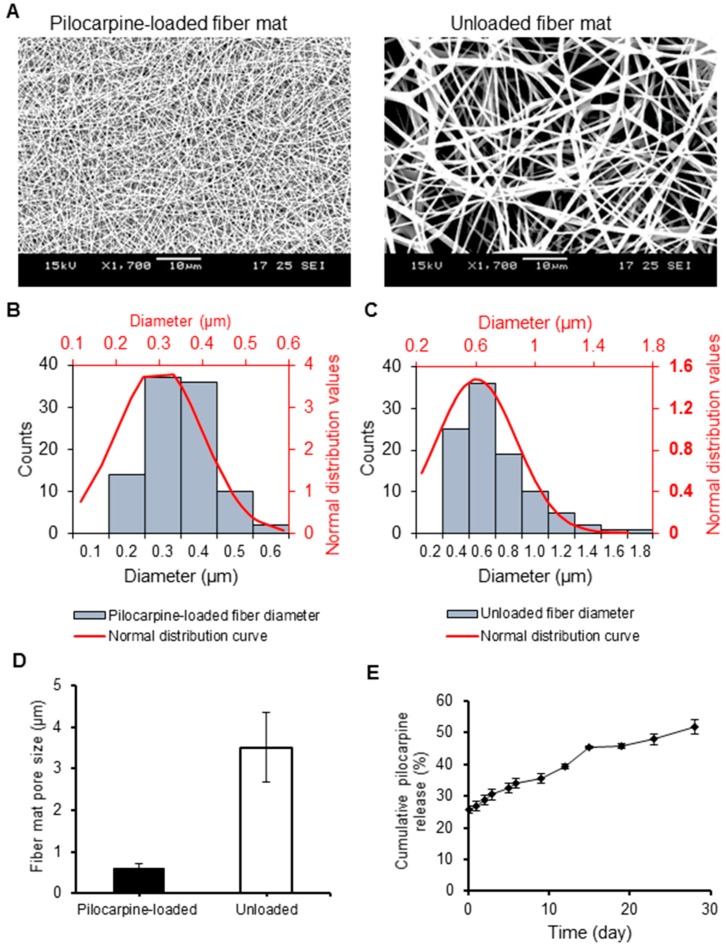
Figure 1.
Structural and morphological comparison of pilocarpine-loaded and unloaded PLGA nanofiber mats, and in vitro pilocarpine release profile from pilocarpine-loaded mats. (A) Scanning electron microscopy (SEM) images at 1700× magnification. (B–C) Diameter distribution of the loaded (left) and unloaded PLGA fiber mats (right). (D) Mean porosity distribution of PLGA fiber mats. Error bars represent SD from n = 10. (E) Cumulative pilocarpine drug release from loaded PLGA nanofibers in the short and long term supported a steady pilocarpine release in vitro. The observed drug release profile was about 26% in the first 4.5 h, and increased steadily to 36% after 9 d, to 45% after 15 d, and to 52% after 28 d. This supports a steady pilocarpine release in vitro. Error bars represent SD from n = 3.

