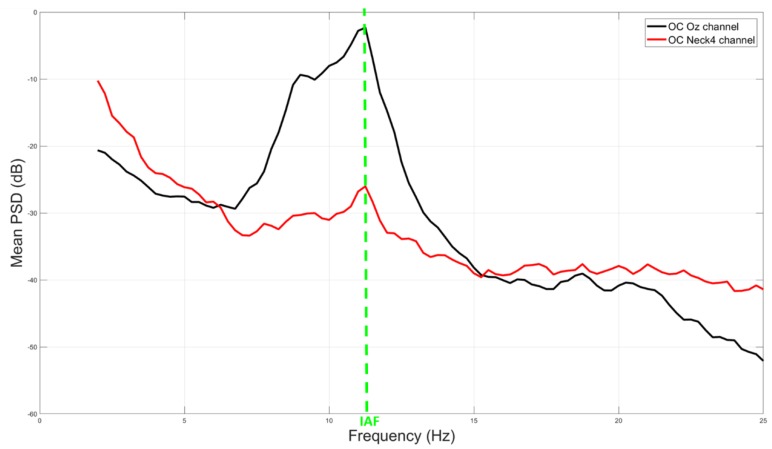
Figure 4.
Representative example of averaged power spectra amplitude difference between EEG (black line) and noEEG (red line) channels. The green arrows highlight the consistence of the Alpha peaks (i.e., IAF value) of the brain (Oz channel) and body (Neck4 channel) spectra in the mean OC condition.

