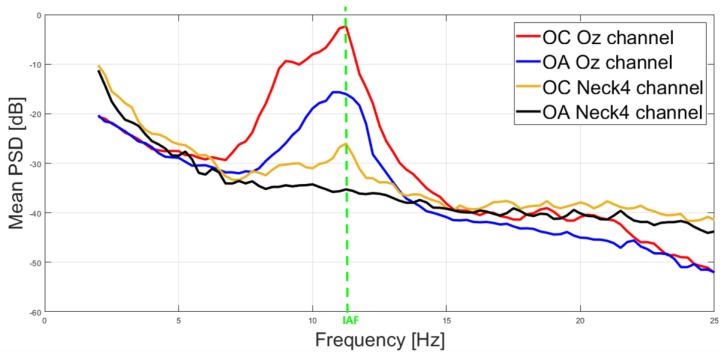
Figure 5.
Similitude of the averaged spectra estimated from EEG (Oz) and noEEG (Neck4) channel. In particular, the red and blue lines show the averaged spectra of the EEG channel, respectively, in the OC and OA conditions. Similarly, the orange and black lines show the averaged spectra of the noEEG channel, respectively, in the OC and OA conditions. The green vertical line aims at highlighting the similitude of the spectras and the equivalent IAF value.

