
Fig. 4.
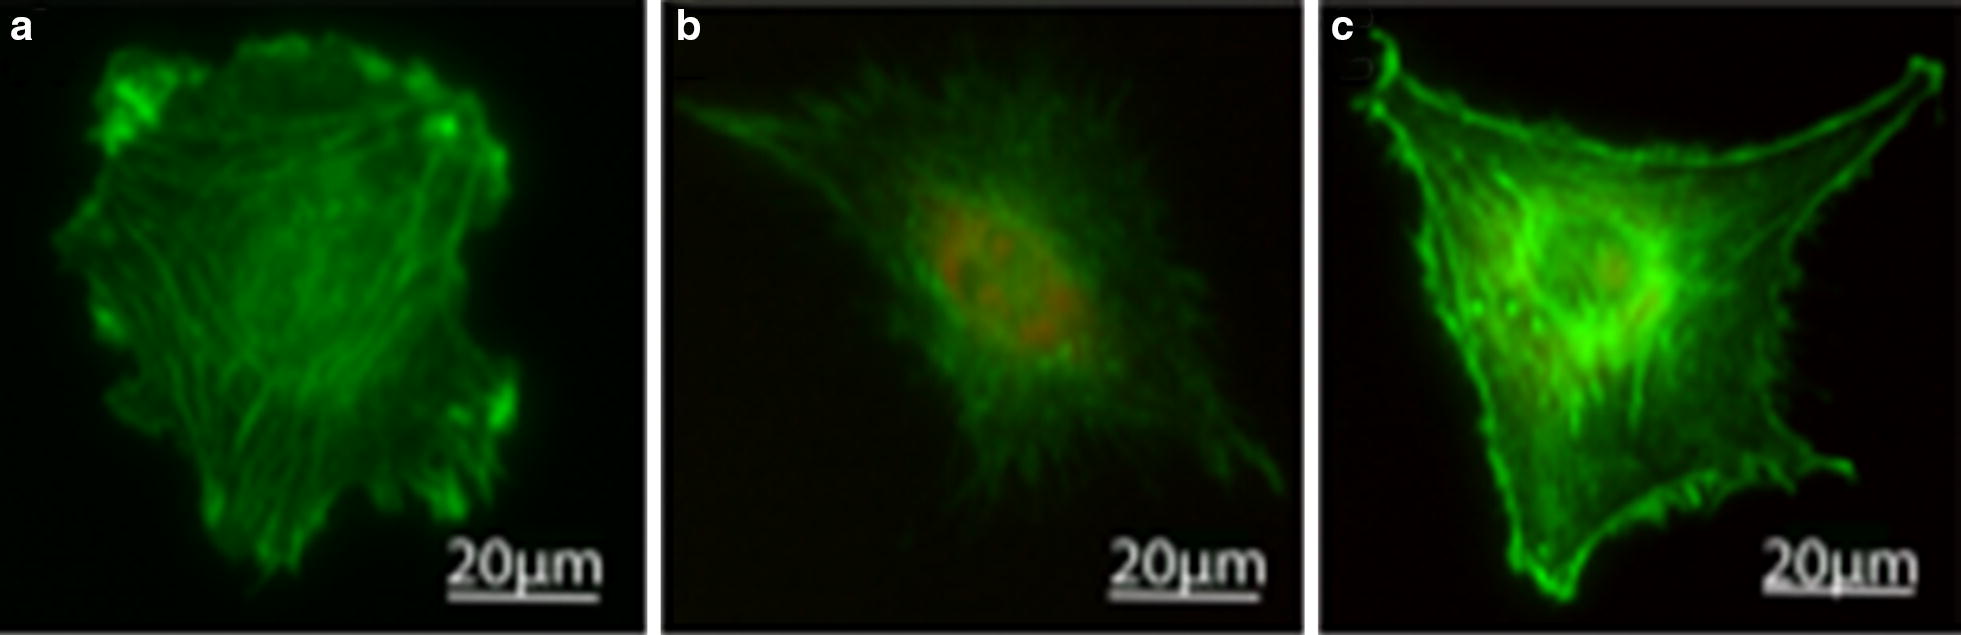
Fluorescent staining of NIH3T3’s cytoskeleton: a control cell; F-actin (green) is highly organized with stress fibers extending continuously along the cells. b The cell exposed to GF for 24 h; the F-actin integrity is compromised and is only observed somewhat organized close to the nucleus. c The cell exposed to MWCNTs for 24 h; the F-actin is dispersed around the cytoplasm. The control cells exceeded, up to eight times, the length of the fibers of the cells exposed to both CBNs (MWCNT and GF). The fiber length was measured by image processing on ImageJ skeleton algorithm. Red indicates the DHE dye, showing the levels of ROS within cells exposed to CNBs