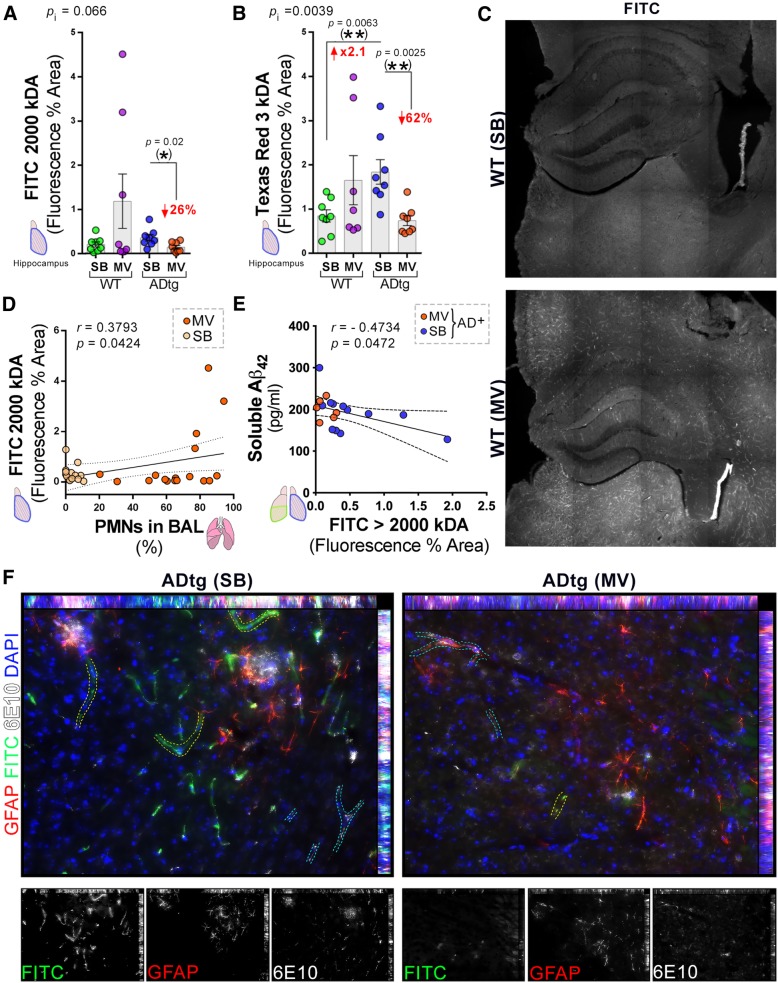
Fig. 4.
Blood-brain barrier permeability in the hippocampus following mechanical ventilation in WT and ADtg mice. Blood-brain barrier damage in the hippocampus was assessed by quantitative analysis of percent area of extravasation of either high molecular weight FITC-dextran (2000 kD) or low molecular weight Texas Red-dextran (3 kD) tracers. a FITC-dextran and b Texas Red-dextran. c Representative confocal images of FITC-dextran tracer in WT mice in the SB (top) and MV (bottom) conditions. d, e Pearson’s r correlation analysis between FITC-dextran hippocampal tracer leakage and d % PMNs in BAL of all animals (n = 8–12 mice/group) and e soluble cerebral Aβ1–42 in both groups of ADtg mice (n = 8–9 mice/group). f Representative fluorescent micrographs of hippocampal ADtg-SB (left) and ADtg-MV (right) immunolabeled for GFAP+ astrocytes (red), 6E10+ human Aβ (white), FITC-dextran extravasation (green) and nuclei (blue). Increased extravasation of FITC-dextran is seen in vessels without 6E10+ Aβ aggregates (traced in yellow dotted lines) while less extravasation of FITC-dextran is seen in vessels with 6E10+ Aβ aggregates (traced in blue dotted lines). Individual channel micrographs are shown below. Data from individual mice in MV (orange dots) and SB (yellow dots) groups are shown, as well as p values (pi = p value for interaction; pMV = p value for MV intervention effect; pg = p value for genotype effect). Fold increase and percentage decreases compared to control groups are shown in red. *p < 0.05, **p < 0.01, using two-way ANOVA with Holm-Sidak’s post hoc multiple comparisons correction, while the asterisk in parenthesis signifies an unpaired two-tailed Student t test. For Pearson’s r correlations, both r and p values, as well as 95% CI dashed lines are presented

