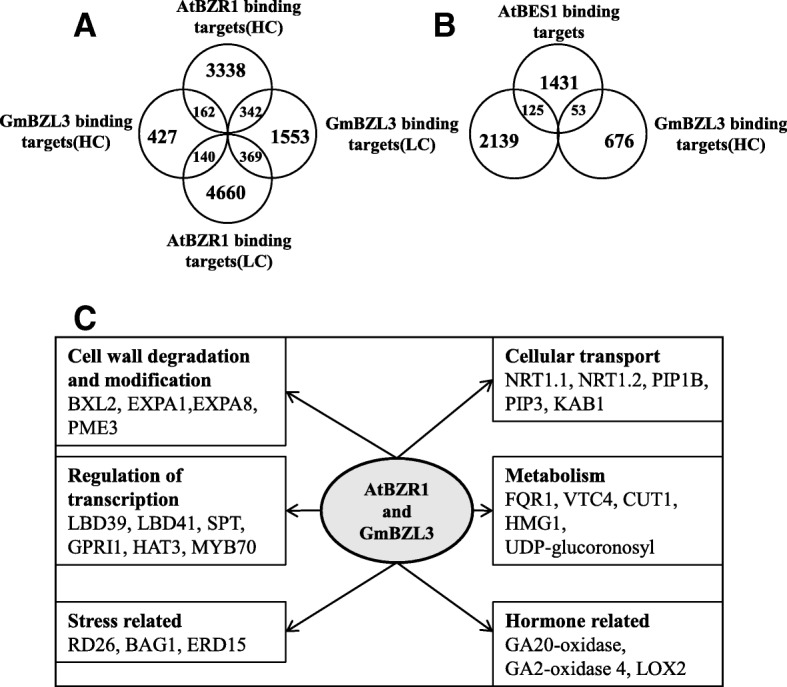
Fig. 6.

Comparison of GmBZL3 and AtBZR1/BES1 targets. a-b Venn diagram showing the overlap of GmBZL3 target genes with BZR1 or BES1 targets. HC: high-confidence. LC: low-confidence. c Representative overlaps of GmBZL3 target genes with BZR1 targets in various cellular, response and metabolic pathways. NRT1.1 (Nitrate transporter 1.1). NRT1.2 (Nitrate transporter 1.2). PIP1B (Plasma membrane intrinsic protein 1;2). PIP3 (Plasma membrane intrinsic protein 3). KAB1 (Potassium channel beta subunit). FQR1 (Flavodoxin-like quinone reductase 1). VTC4 (Inositol monophosphatase family protein). CUT1 (Cuticular 1). HMG1 (3-hydroxy-3-methylglutaryl coa reductase). LOX2 (Lipoxygenase 2). BXL2 (Beta-xylosidase 2). EXPA1 (Expansin A1). EXPA8 (Expansin A8). PME3 (Pectin methylesterase 3). LBD39 (lateral organ boundaries domain protein 39). LBD41 (lateral organ boundaries domain protein 41). SPT (SPATULA). GPRI1 (GOLDEN2-like 1). HAT3 (Homeobox-leucine zipper protein 3). AtMYB70 (Myb domain protein 70). RD26 (Responsive to dessication 26). BAG1 (BCL-2-associated athanogene 1). ERD15 (Early responsive to dehydration 15)
