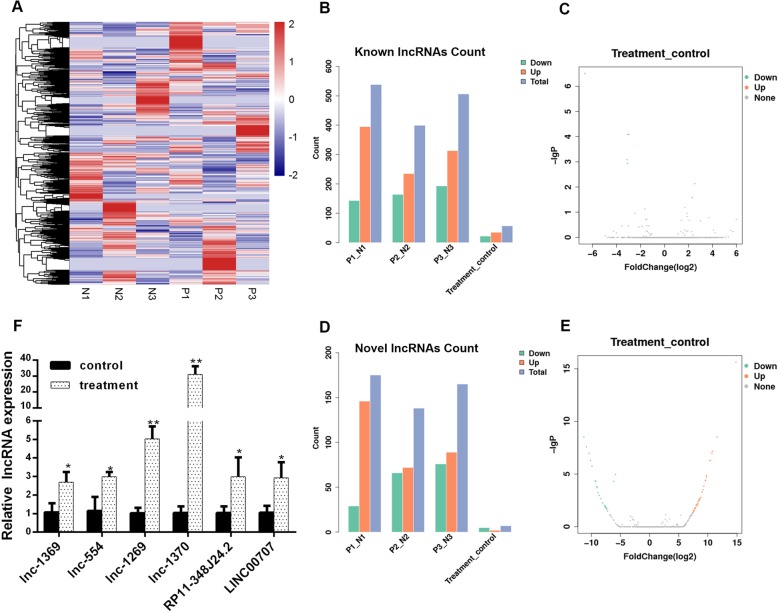
Fig. 1.
High-throughput sequencing analysis of lncRNA in HBMSCs treated with osteogenic-induced medium for 15 days. a Heatmap of differentially expressed lncRNAs after osteogenic differentiation induction. b Counts of known differentially expressed lncRNAs in each group. c Volcano plot of known differentially expressed C. d Counts of unknown differentially expressed lncRNAs in each group. e Volcano plot of unknown differentially expressed lncRNAs. f qRT-PCR validation of known and unknown lncRNAs with the largest fold change. Data represent mean ± S.D. *P<0.05, **P<0.01

