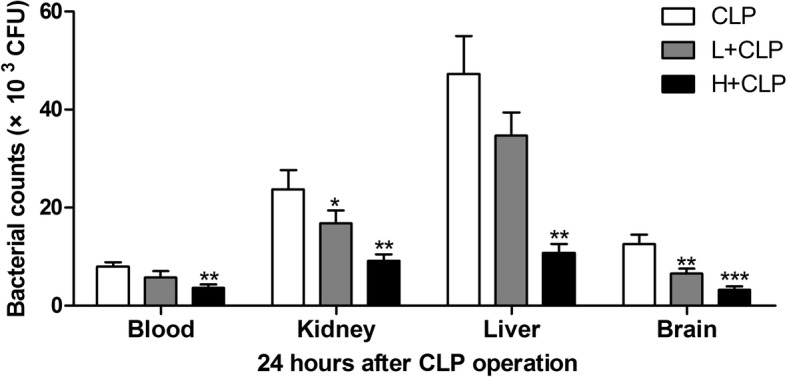
Fig. 2.

The blood, kidney, liver and brain were collected, and bacterial counts were measured in CLP-induced septic mice. Values are expressed as mean ± SEM, n = 10 in H + CLP group and n = 8 in CLP or L + CLP group. * P < 0.05, ** P < 0.01, *** P < 0.001, versus S. aureus or CLP single treatment group
