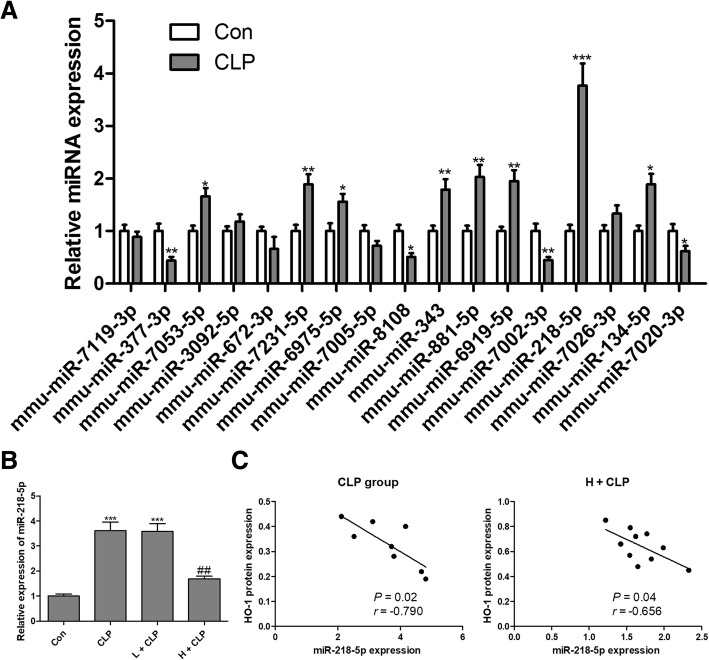
Fig. 5.
MiRNA expression in the kidney from septic mice. HO-1-related miRNAs were predicted using online software TargetScan (www.targetscan.org) and miRDB (http://www.mirdb.org/miRDB/), and the expression levels of 17 miRNAs were measured by RT-qPCR assays (a). After treatment with honokiol, the expression of miR-218-5p was measured using RT-qPCR in the kidney (b). Spearman’s rank analysis was used to identify the correlation between HO-1 and miR-218-5p expression levels in the kidney of septic mice with CLP or CLP combined with honokiol treatment (c). Values are expressed as mean ± SEM, n = 10 in Con or H + CLP group and n = 8 in CLP or L + CLP group. * P < 0.05, ** P < 0.01, *** P < 0.001, versus control group; ## P < 0.01 versus CLP group

