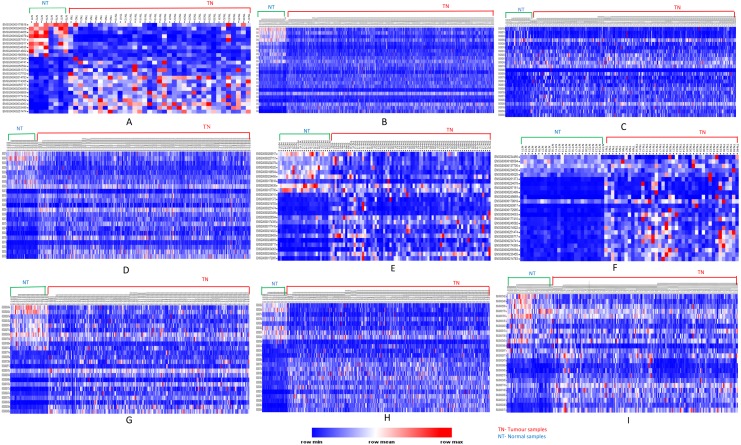
Figure 5. Heatmap showing common up- and down-regulated lncRNA genes in tumors.
Rows refer to lncRNA and columns are the samples. The red color bar indicates lncRNAs with higher expression levels and the blue color indicates lncRNAs with lower expression levels. N: Normal samples; T: Tumor samples. (A) BLCA, (B) BRCA, (C) HNSC, (D) KIRC, (E) KIRP, (F) LIHC, (G) LUAD, (H) LUSC, (I) PRAD.

