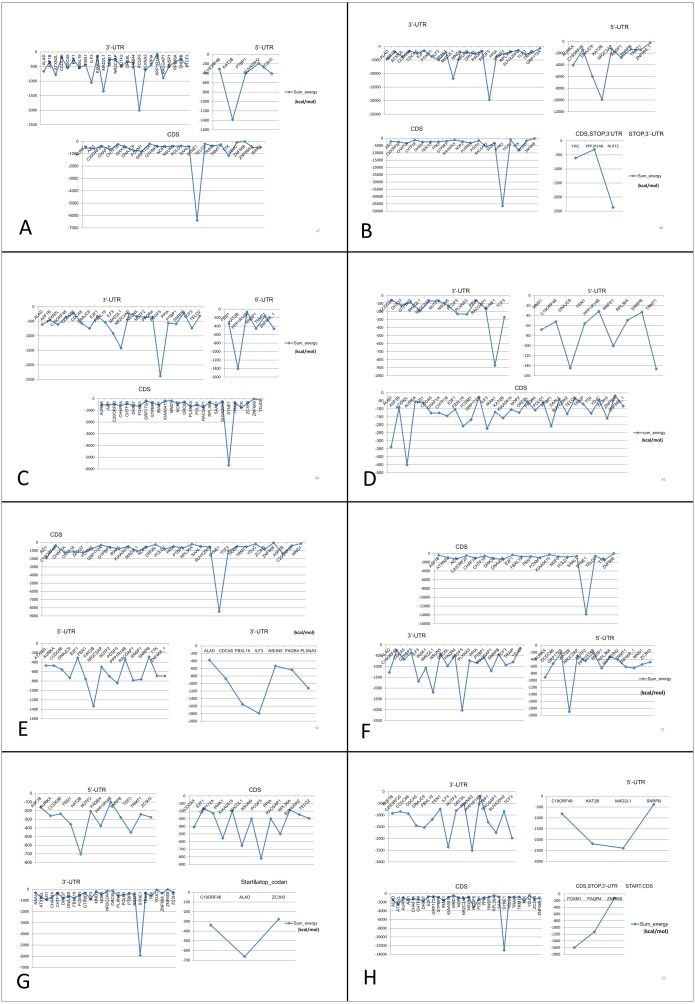
Figure 7. Prediction of lncRNA-mRNA interaction and their binding sites.
Their corresponding binding energies (sumenergy) show the intensity of interactions with higher negative binding energy meaning tighter association leading to more favorable or stable interaction. (A) AC005154.5, (B) MAGI2-AS3, (C) MIR22HG, (D) PVT1, (E) RP11-368I7.2, (F) RP11-1149O23.3, (G) SNHG11, (H) UHRF1.

