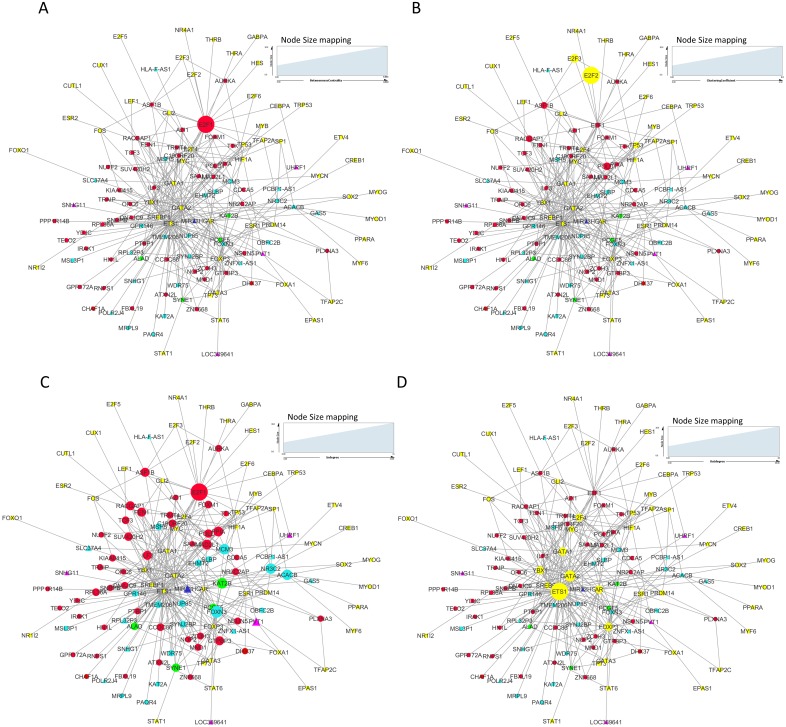
Figure 8. Master regulatory network parameters.
(A) Betweenness centrality: E2F1 showing highest betweenness centrality; (B) Clustering coefficient: E2F2, E2F3, ASF1B, POLD1 and RACGAP1 genes are clustered together; (C) Indegree: Number of inward directed nodes, E2F1 has highest number of in-degree nodes; (D) Outdegree: Number of outward directed nodes, ETS1 has highest out degree node. The node size increases with values of the respective topological parameter.

