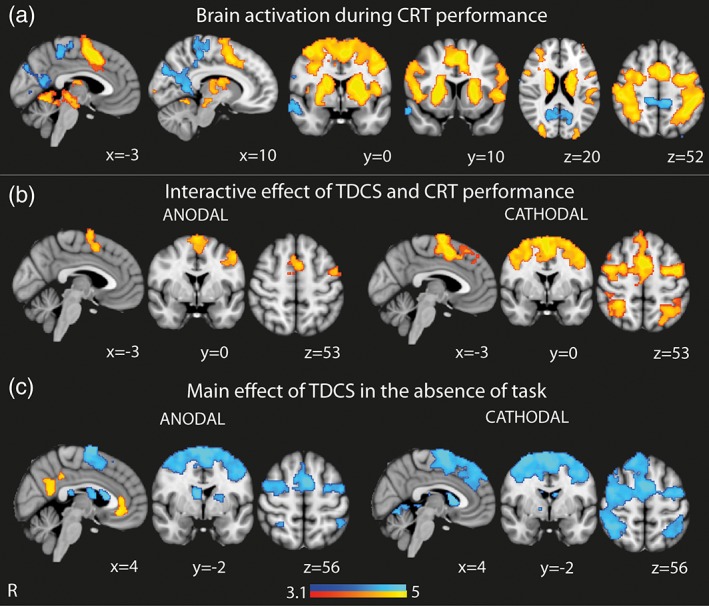
Figure 2.

Brain activity with tDCS during “rest” and CRT performance. (a) Overlay of brain activation and deactivation associated with CRT performance (with no TDCS). (b) Brain areas showing greater activation when tDCS is applied during CRT performance. Results shown demonstrate the interactive effects of tDCS and CRT performance. (c) Brain areas showing greater activation and deactivation as a result of the main effect of tDCS in the absence of CRT performance. Warm colors represent brain regions showing more activation and cool colors represent brain regions showing more deactivation. Results are superimposed on the MNI152 1 mm brain template. Cluster corrected z = 3.1, p < .05 [Color figure can be viewed at https://wileyonlinelibrary.com]
