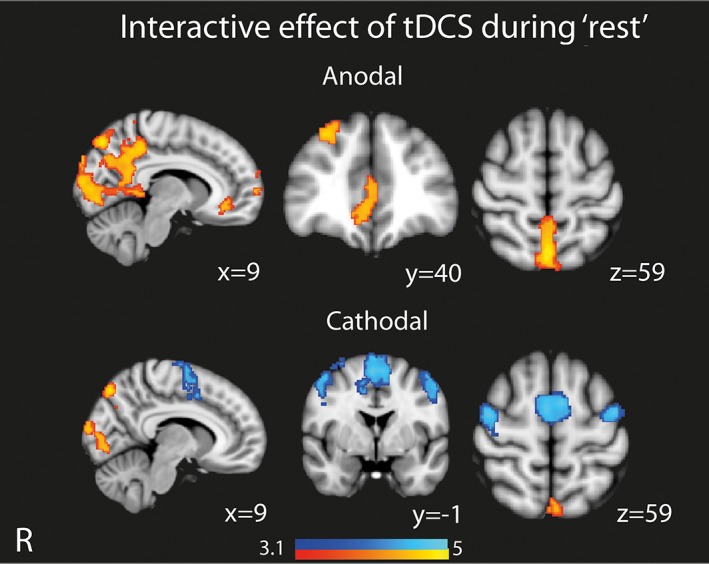
Figure 3.

Overlay of brain areas showing activation and deactivation when tDCS is applied during “rest.” Results shown demonstrate the interactive effects of tDCS and “rest.” Results are superimposed on the MNI152 1 mm brain template. Cluster corrected z = 3.1, p < .05 [Color figure can be viewed at https://wileyonlinelibrary.com]
