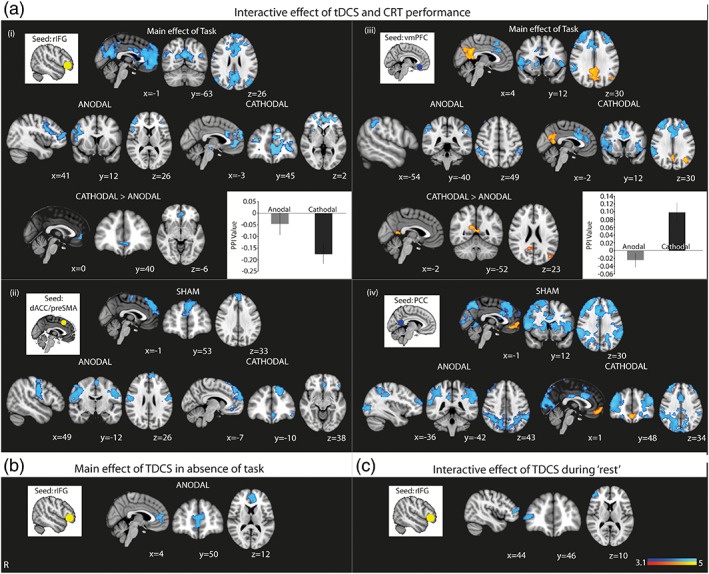
Figure 5.

Functional connectivity during different stimulation polarities and brain states. (a) Results show increased (warm colors) and decreased (cool colors) FC between the overlaid areas and the (i) right inferior frontal gyrus (rIFG), (ii) dorsal anterior cingulate cortex (dACC), (iii) ventromedial prefrontal cortex (vmPFC), and (iv) the posterior cingulate cortex (PCC) when stimulation is applied during CRT performance. Results for anodal and cathodal tDCS denote the change in FC over and above that produced by CRT performance in the sham condition. Accompanying insets show the seed ROI used for the PPI analysis. Where there is a significant whole‐brain result for the direct comparison of anodal and cathodal stimulation, for the rIFG and vmPFC seeds, this is also shown, in (i) and (iii). Accompanying bar chart shows the mean PPI value in the overlaid areas under anodal and cathodal tDCS, and are provided to show the direction of change. (b) Results show decreased (cool colors) FC between the overlaid areas and the rIFG for the main effect of anodal tDCS. (c) Results show decreased (cool colors) FC between the overlaid areas and the rIFG when anodal tDCS is applied during “rest”. There were no significant whole‐brain results from the other seed regions. Results are superimposed on the MNI152 1 mm brain template. Cluster corrected z = 3.1, p < .05. Bar charts denote mean values, error bars are SEMs [Color figure can be viewed at https://wileyonlinelibrary.com]
