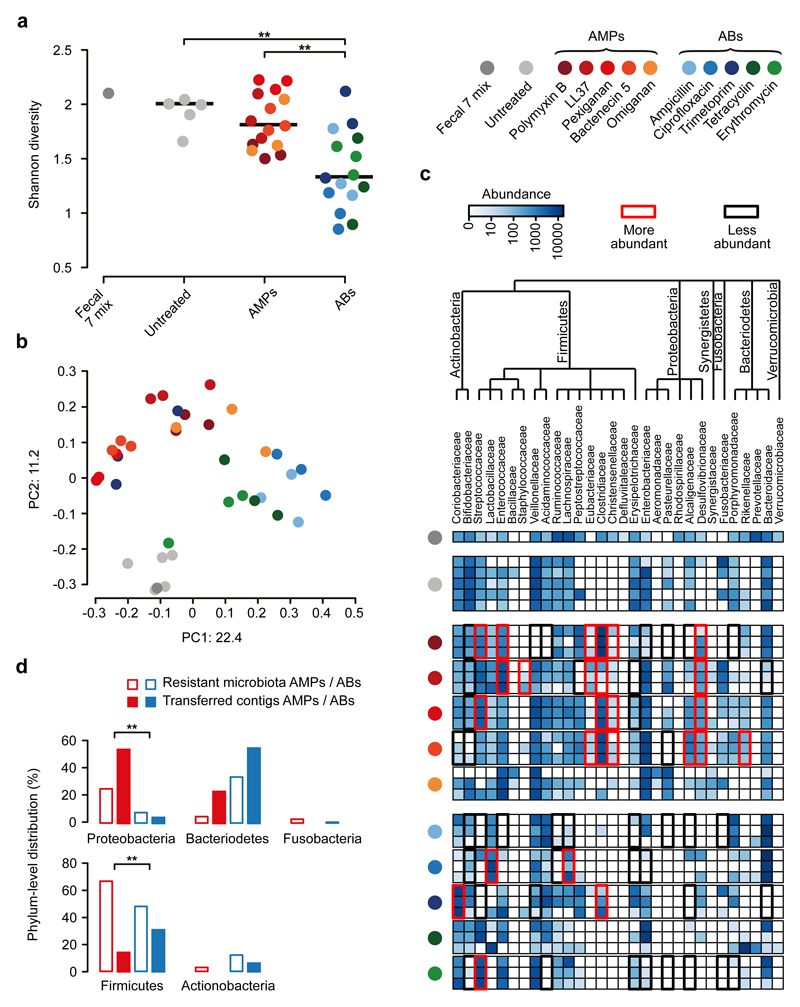
Fig. 3. Culturing reveals that short genomic DNA fragments from the gut microbiota have a limited potential to transfer AMP resistance to E. coli.
a) Diversities of the cultured microbiota and the original fecal sample (Fecal 7 mix). Data represents Shannon alpha diversity indexes at family level based on 16S rRNA profiling of V4 region. AMP/antibiotic (AB) treatments are colour-coded. Untreated samples were grown in the absence of any AMP or AB. ** indicates a significant difference from two-sided Mann-Whitney U test, p=0.005 for Untreated vs ABs, p=3*10-4 for AMPs vs ABs. Sample sizes were 5, 15 and 15 for Untreated, AMPs and ABs, respectively. Central horizontal bars represent median values. b) A PCoA (principal coordinate analysis) plot based on unweighted UniFrac distances34 separates the AMP- and antibiotic-resistant, and the untreated microbial communities (p=0.001, PERMANOVA test, n=36). c) Differential abundance analyses between the untreated and the AMP- and antibiotic-resistant microbiota at the family level (see Methods). Brackets depict a significant increase (red) or decrease (black) in abundance of a given family as a consequence of AMP or antibiotic (AB) treatment based on pairwise two-sided negative binomial tests (see Methods). Sample sizes were 5 and 3-3 for Untreated and AMPs and ABs, respectively. The phylogenetic tree is based on the assignment of the NCBI Taxonomy database and created by using ete3 toolkit37. d) Phylum-level distributions of resistant gut bacteria and resistance DNA contigs originating from them. Compared to their relative frequencies in the drug-treated cultured microbiota (based on colony numbers), the phylogenetically close Proteobacteria contributed disproportionally more AMP- (red bars) than antibiotic-resistance contigs (AB, blue bars), whereas the opposite pattern was seen for the distantly related Firmicutes. Asterisks indicate significant interaction terms in logistic regression models, p=0.018 (*) and p=0.003 (**) for Proteobacteria and Firmicutes, respectively (for more details see Methods and Supplementary Table 11). Sample sizes were 22651 and 24336 for the total colony number of AMP-resistant and AB-resistant microbiota, respectively,and 33 and 54 for the number of transferred AMP-resistant and AB-resistant contigs, respectively.

