
Figure 2: PL activation patterns during fear learning and memory retrieval over time.
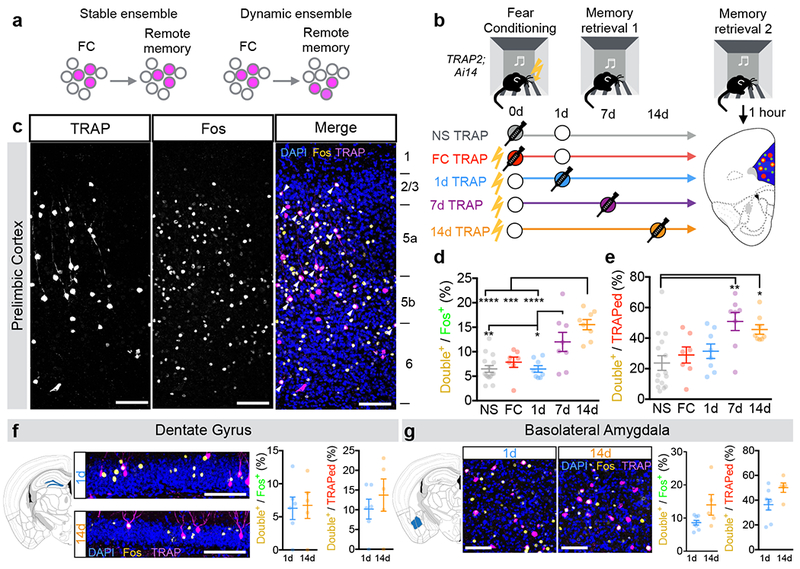
a, Potential relationships between PL neurons activated during learning (FC) and remote memory retrieval. b, Experimental design to test models. Circles represent an experience. Filled circles represent experiences paired with 4-OHT injection (TRAPed experience). For simplicity, we depict NS controls as having a retrieval on day 1; however, NS controls were balanced across groups with retrievals occurring on days 1, 7, or 14. c, Example confocal images of TRAPed (left), Fos+ (middle), and TRAP/Fos double-labeled (right) PL neurons from a 7d TRAP2;Ai14 mouse. d, e, Quantification of percent of Fos+ neurons that are TRAPed (d, F(4,41)=13.03, P<0.0001) and percent of TRAPed neurons that are Fos+ (e, F(4,41)=5.45, P=0.0013). N=15, 8, 8, 8, 8 for NS, FC, 1d, 7d, 14d, respectively; one-way ANOVA with Holm-Sidak post-hoc test. Example confocal images and quantifications of of TRAPed and Fos+ cells from 1d- and 14d-TRAPed brains in dentate gyrus (f, Double+/Fos+: P=0.87, t9=0.17; Double+/TRAPed: P=0.46, t9=0.77; N=6, 5 for 1d and 14d, respectively, two-sided unpaired t-test) and basolateral amygdala (g, Double+/Fos+: P=0.0595, t11=2.10; Double+/TRAPed: P=0.0527, t11=2.17; N=8, 5 for 1d and 14d, respectively, two-sided unpaired t-test). Scale bars, 100µm. In all plots and statistical tests, N represents biologically independent animals. Summary graphs show mean±SEM. *P<0.05, **P<0.01, ***P<0.001, ****P<0.0001.