
Figure. 6: Whole-brain analyses of network involving TRAPed PL neurons.
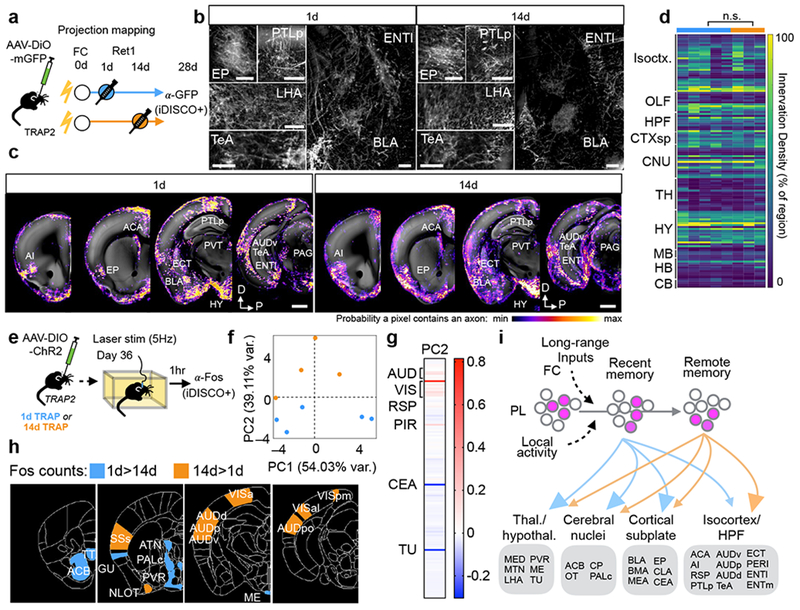
a–d, Projection mapping of 1d- and 14d-TRAPed PL neurons. a, Experimental design. b, Coronal 100μm optical stacks showing iDISCO+ labeling of GFP+ axons from TRAPed PL neurons in representative brains. Scale bars, 200µm. c, Probability maps showing 1d- and 14d-TRAPed PL axon innervation by region from representative brains overlaid onto a standard brain. d, Heatmap showing axon innervation by region for TRAPed axons (1d: N=5, 14d: N=3 biologically independent animals, see also Table S3 for statistical comparisons). e–g, Whole-brain Fos patterns in response to activating 1d- and 14d-TRAPed PL neurons. e, Experimental design. f, Locations of individual mice projected in principal component (PC) space defined by the first two PCs (arbitrary PC units, 1d: N=5, 14d: N=4 biologically independent animals). g, Loadings for PC2 (arbitrary PC weight units). h, Visualization of regions with differential Fos expression in 1d- and 14d-TRAPed brains (1d: N=5, 14d: N=4 biologically independent animals; see also Table S4). i, Working model representing that PL ensembles involved in the memory trace are recruited over time and that despite having similar projection patterns, PL cells involved in remote memory more strongly recruit cortical targets. See Methods for anatomical abbreviations.